

Analyzing Everyone’s Favourite Bitcoin Indicator
Unpacking Bitcoin’s Rhythm Through The Pi Cycle Top Indicator

Hey everyone, and welcome back to the On-Chain Mind Newsletter.
Bitcoin’s cycles are a study in extremes: violent chop, euphoric peaks, and inevitable corrections. And among the many metrics that attempt to capture the market’s rhythm, there’s one that has stood out for its uncanny ability to pinpoint cycle peaks: the Pi Cycle Top Indicator. But what if this tool, celebrated for its historical precision, is evolving alongside Bitcoin’s maturing market?
In this article, we’ll dissect its mechanics, explore its current signals, and introduce an enhanced adaptation that should keep us safe in an ever-changing market landscape.
Let’s get into it.
Insights at a Glance:
Capturing The Market’s Cadence: The Pi Cycle Top pinpoints moments when short-term exuberance surges past Bitcoin’s foundational trends.
Embracing Evolution: Bitcoin’s maturing cycles show less intense peaks over time; recognising this shift is crucial to avoid mistiming exits in an increasingly stable market.
Use Diverse Signals: No single “master metric” reigns supreme—blend the oscillator with on-chain analytics, macroeconomic trends, and sentiment indicators for a well-rounded strategy.
Stay Agile for Uncertainty: Though explosive rallies are likely, scenarios like steady climbs or prolonged consolidation require adaptable approaches to navigate effectively.
The Mechanics of the Pi Cycle Top
Bitcoin’s price cycles are not random chaos; they follow a rhythmic pattern driven by human psychology, market adoption, and economic forces. At the heart of this rhythm lies the Pi Cycle Top Indicator, a deceptively simple tool that has earned its place in the pantheon of Bitcoin analytics.
At first glance, the indicator is elegantly simple. It plots two moving averages: the 111-day simple moving average (SMA) and the 350-day x2 SMA. When the shorter SMA crosses above the longer one, the market is typically in a state of extreme euphoria and has historically coincided with Bitcoin’s cycle peaks.
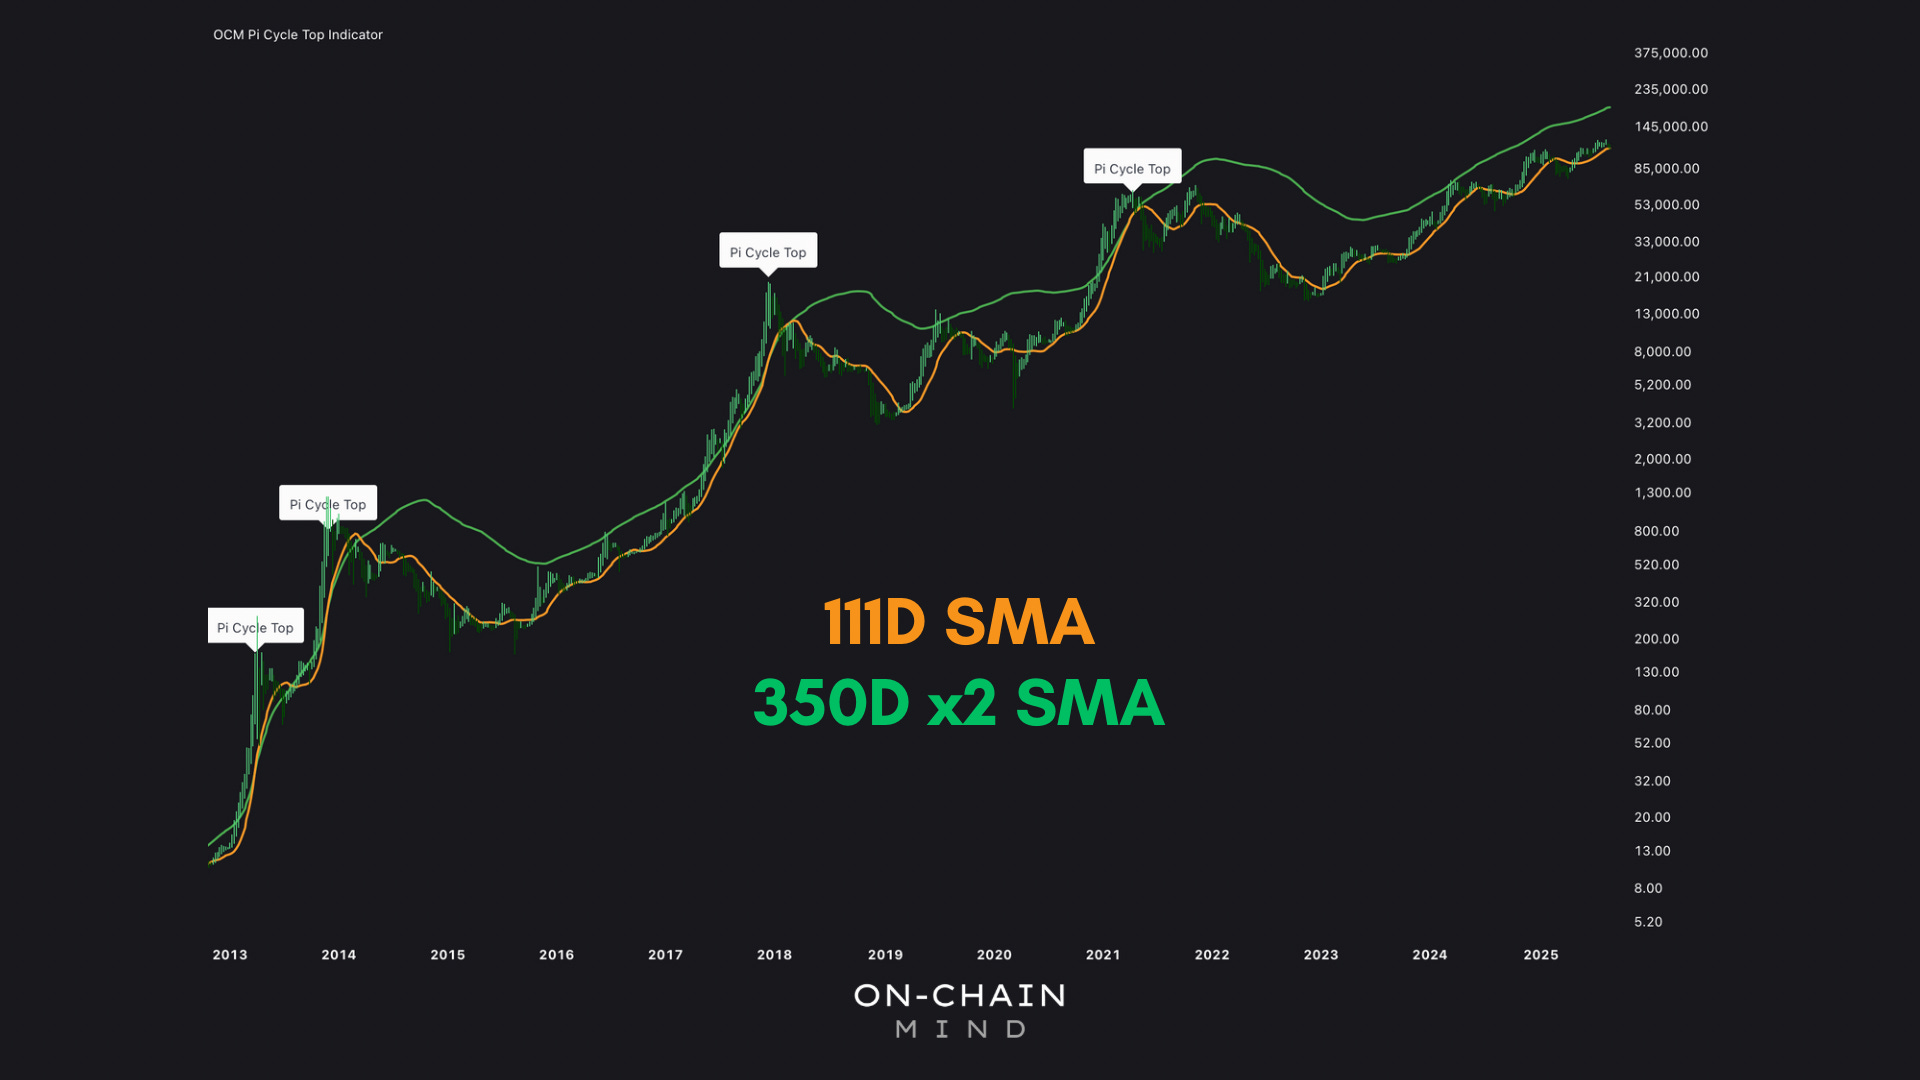
The brilliance of the Pi Cycle Top lies in its ability to capture momentum divergence. The short-term SMA reacts quickly to recent price acceleration, reflecting the enthusiasm and FOMO of traders. The longer-term SMA smooths out short-term fluctuations, representing the market’s structural norm. When these averages converge, it signals that short-term gains have far outpaced underlying stability — a mathematically precise reflection of late-cycle euphoria.
Historically, the indicator has flagged every one of Bitcoin’s famous peaks:
2013: The market’s first blow-off rally, ending in a sharp correction.
2014: The double peak of the cycle, captured perfectly again within days.
2017: Bitcoin reached nearly $20,000 just as the 111-day SMA crossed the double-weighted 350-day average.
2021: The crossover coincided with the on-chain peak, perfectly marking the end of the parabolic run before a dead cat bounce to the bottom.
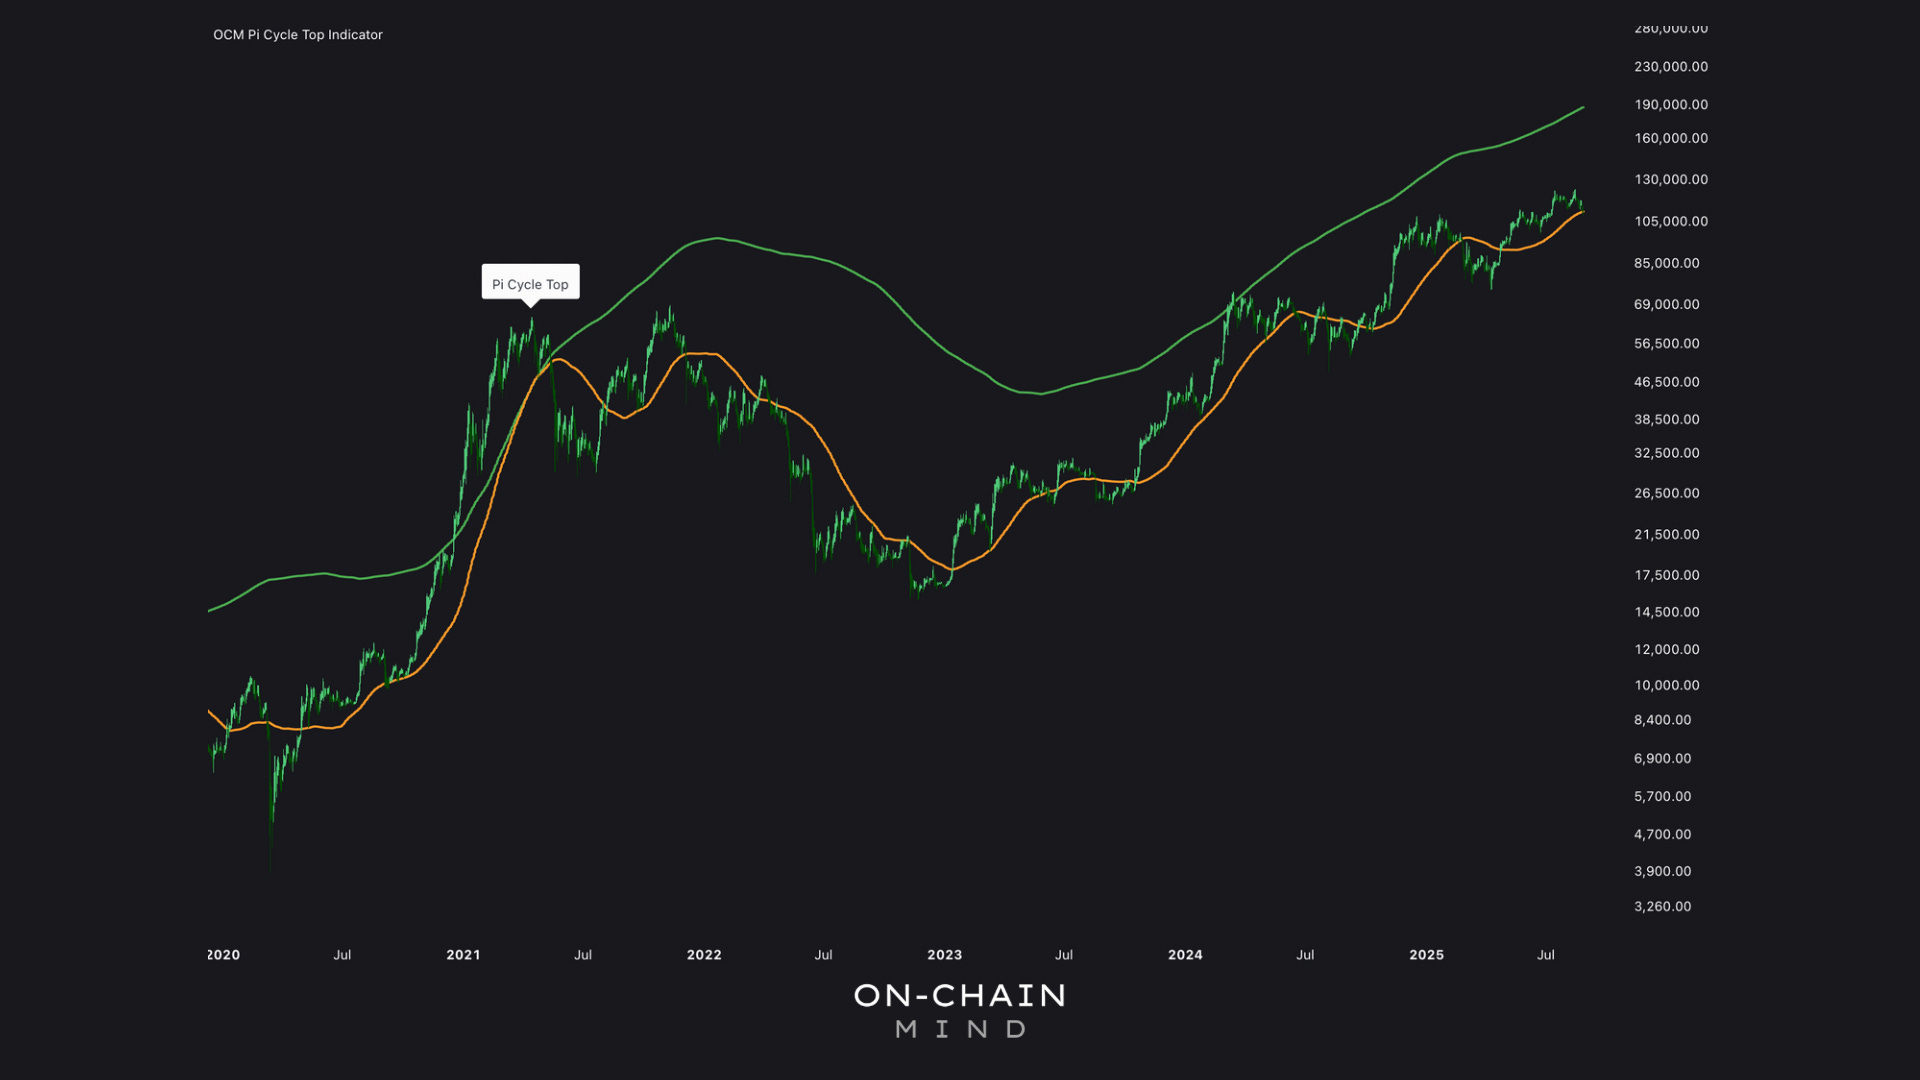
While the Pi Cycle Top provides remarkable insight into market extremes, it is not a crystal ball. It confirms conditions of euphoria rather than predict exact future peaks. Today, Bitcoin’s famous moving averages remain widely separated, suggesting that the conditions that historically trigger a crossover — a full-blown, parabolic rally — have yet to materialise.
Limitations of the Classic Indicator
The Pi Cycle Top is valuable for recognising historical cycle tops, but it comes with limitations that we should all understand. In the current market, the fast-moving average hovers near $110,000, while the double-weighted long-term average sits around $187,000. For a traditional crossover to occur, Bitcoin would need to surge likely past $200,000, a scenario requiring intense FOMO and near-vertical price action from this point.
The indicator also offers a binary signal: either a crossover occurs or it doesn’t. This “all-or-nothing” nature can leave investors exposed if price begins to plateau below the crossover threshold, or if market peaks diminish over time — a phenomenon increasingly evident as Bitcoin matures. Let’s explore that concept further.
The Pi Cycle Top Oscillator
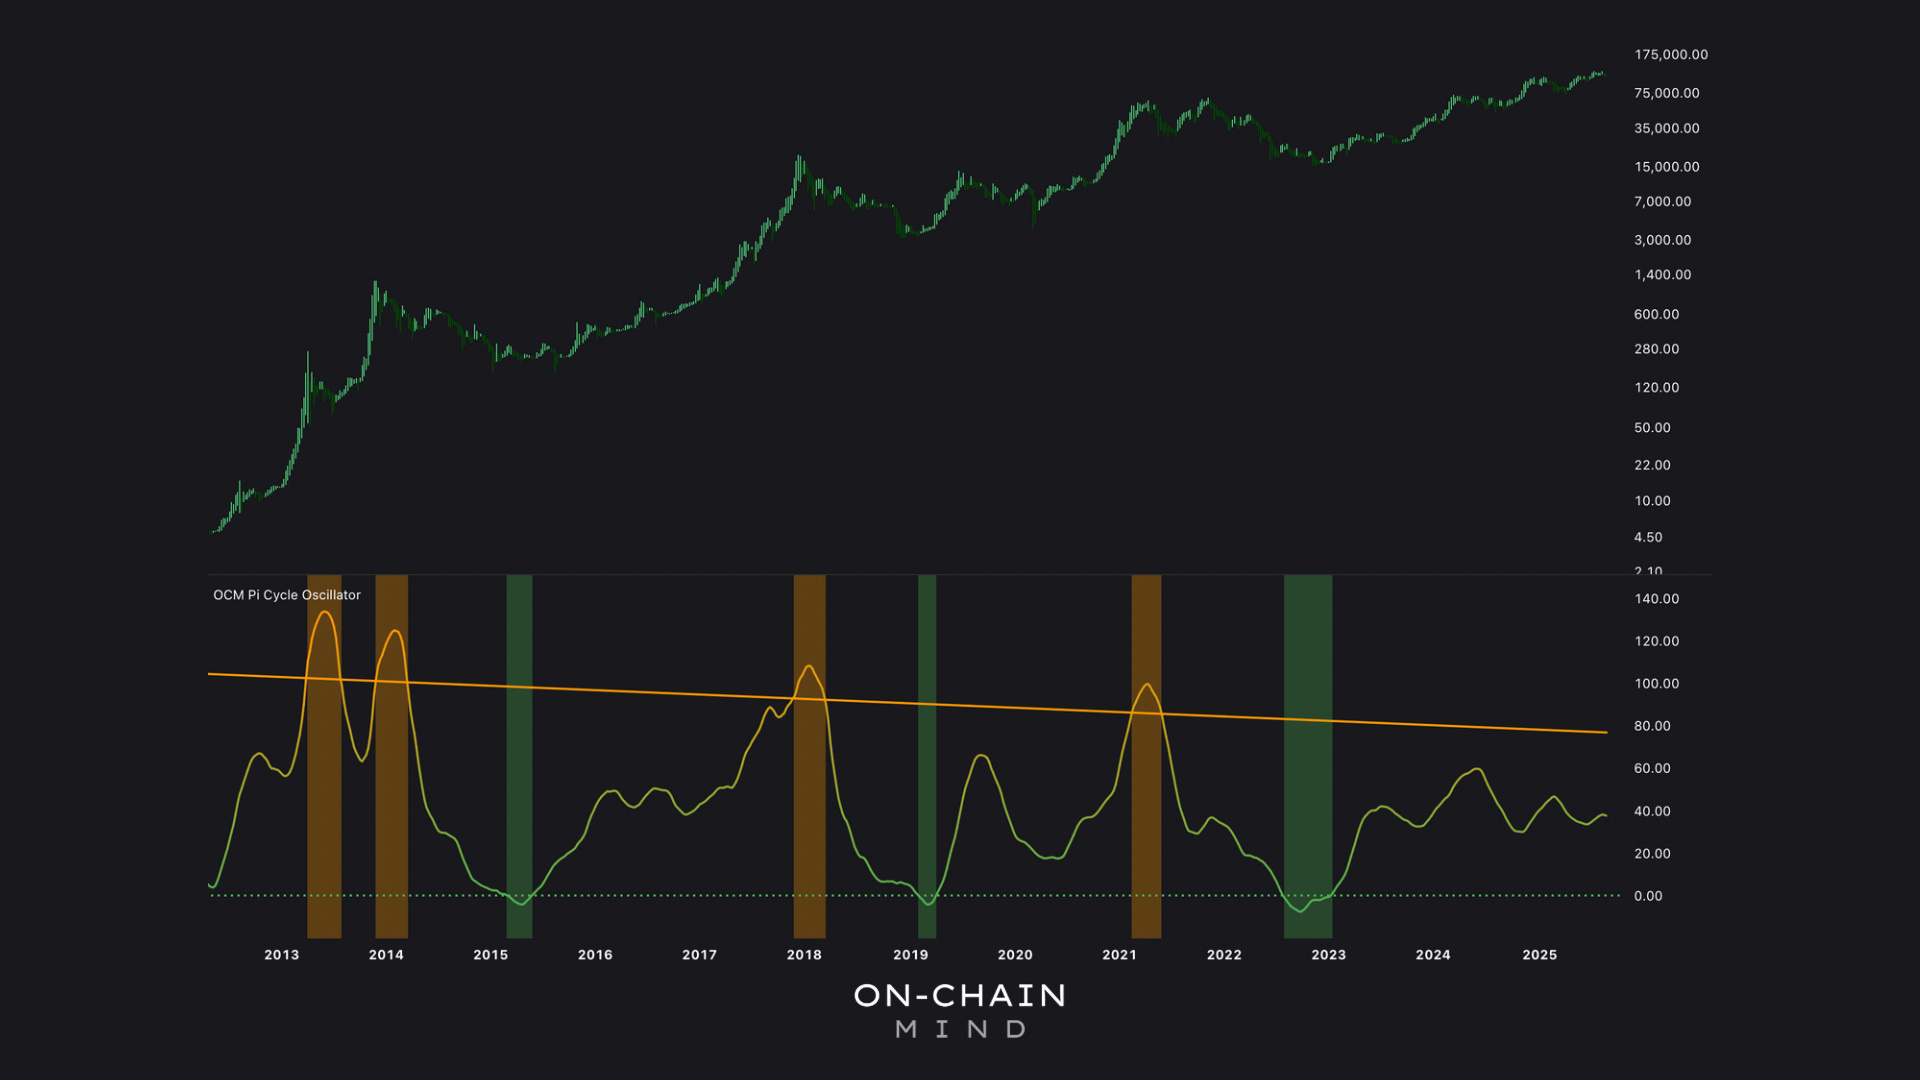
To address these limitations, the Pi Cycle Top Oscillator transforms the traditional crossover into a continuous, real-time measure of risk and cycle positioning. Rather than providing a single binary signal, the oscillator calculates the percentage divergence between the 111-day and 350-day ×2 SMAs and normalises it into a readable scale.
Orange backgrounds appear when moving averages converge, historically signalling tops.
Green highlights periods where the averages are far apart, aligning with bottoms.
This continuous scale provides several advantages over the traditional indicator. It allows us to monitor risk in real time, adjusting positions incrementally instead of waiting for an all-or-nothing crossover. It also captures the diminishing intensity of cycle peaks, because each new cycle may not reach the same extremes as its predecessors.
Each cycle peak has become progressively smaller in relative terms. Here are the peak oscillator readings:
2013/14 cycles: 130
2017 cycle: 110
2021 cycle: 100
Bitcoin’s evolving market structure means simply waiting for a classic crossover can result in missed opportunities or delayed exits. A more dynamic approach is necessary.
Currently, the oscillator reads around 37, far from levels historically associated with cycle tops. This suggests that, while Bitcoin has experienced strong bullish runs in early 2024 and 2025, the market has yet to enter the late-cycle euphoria that typically precedes a blow-off peak. By tracking the oscillator, and for those looking to take profits this cycle, scaling out of positions when the readings approach 75 or higher might be a prudent option.
Limitations and Future Scenarios
While the oscillator offers superior granularity to the classical indicator, it’s not without its flaws. And it all hinges on two major assumptions:
The continued diminishing peaks as Bitcoin matures;
The occurrence of a parabolic finale to the cycle.
The former seems likely, but the latter is debatable. Could this cycle forgo a blow-off top for a gradual ascent, driven by sustained institutional buying rather than retail hype?
Absolutely. This prolonged step-ladder grind up could continue to persist, followed by a bleed in enthusiasm without a massive crash. In such a case, the oscillator will almost certainly underperform, as it relies on vertical rallies to spike its readings. And that’s why it’s important to mitigate these single indicator risks by integrating it with a multifaceted toolkit of on-chain analysis and other macro signals.
I’m going to study this “slow bleed” scenario and what potential implications it might have on our portfolios this cycle, because nothing is guaranteed. Just because we’ve experienced a FOMO-driven blow-off top every cycle before, doesn’t mean it has to happen this time again.
But for me personally, I completely subscribe to the notion of: while history doesn’t repeat, it certainly does rhyme. And in a market as volatile and psychologically charged as Bitcoin, I’m certainly tilted towards expecting a climactic rally at some point. But when that occurs, is anyone’s guess.
Key Takeaways
Cycle Rhythms: The Pi Cycle Top reveals when short-term euphoria overtakes long-term trends, but its oscillator adaptation provides a cleaner exit strategy.
Account for Maturation: Diminishing peak intensities reveal Bitcoin’s evolution; adjust expectations accordingly to avoid missing the exit.
Seek Confluence: No indicator is supreme—combine with on-chain, macro, and sentiment data for a more robust strategy.
Prepare for Variability: While parabolic tops are probable, alternative scenarios like gradual grinds demands a more flexible approach.
If you want to unlock the full picture — including access to my Custom Indicator Suite — consider upgrading to Premium 🚀
I’ll catch you in the next one.
Cheers,
OCM
🎥 Watch the video of this article on YouTube!👇🏼
Subscribe to the On-Chain Mind YouTube Channel!