

Bitcoin Bear or Just Another Pullback?
Understanding Bitcoin’s Latest Correction: Shakeout or Structural Shift?

Hey everyone, and welcome back to the On-Chain Mind Newsletter.
Bitcoin has dropped 12% from its all-time high, and the chatter online suggests the bull market might be over. But is this really the start of a crash, or simply another classic shakeout in Bitcoin’s volatile journey?
In this article, I’ll compare today’s market structure with previous cycles, and identify the critical levels that will determine whether this correction is healthy or something more concerning.
Let’s get into it.
Insights at a Glance:
Historical Context Reveals Normality: Bitcoin’s current 12% correction pales in comparison to frequent 20-40% drawdowns in past bull cycles, suggesting this is routine volatility rather than a reversal.
Key Support Levels to Watch: Metrics like the short-term holder realized price ($109,000) and moving averages ($101,000 for 200-day, $93,000 for yearly) will determine if the bull trend holds.
Investor Mindset Shift: Viewing corrections as accumulation opportunities can transform fear into strategy, especially for long-term holders.
No Signs of Capitulation Yet: Indicators such as the Spent Output Profit Ratio (SOPR) show profits being realised, not losses, indicating sustained bullish structure.
Contextualising the Correction
It has been roughly 2 weeks since Bitcoin retraced from its $124,000 all-time high. Naturally, questions arise: is this a mere short-term pause, or the start of a deeper contraction?
To contextualise, we can examine the Depth Map, which measures current drawdowns from previous all-time highs.
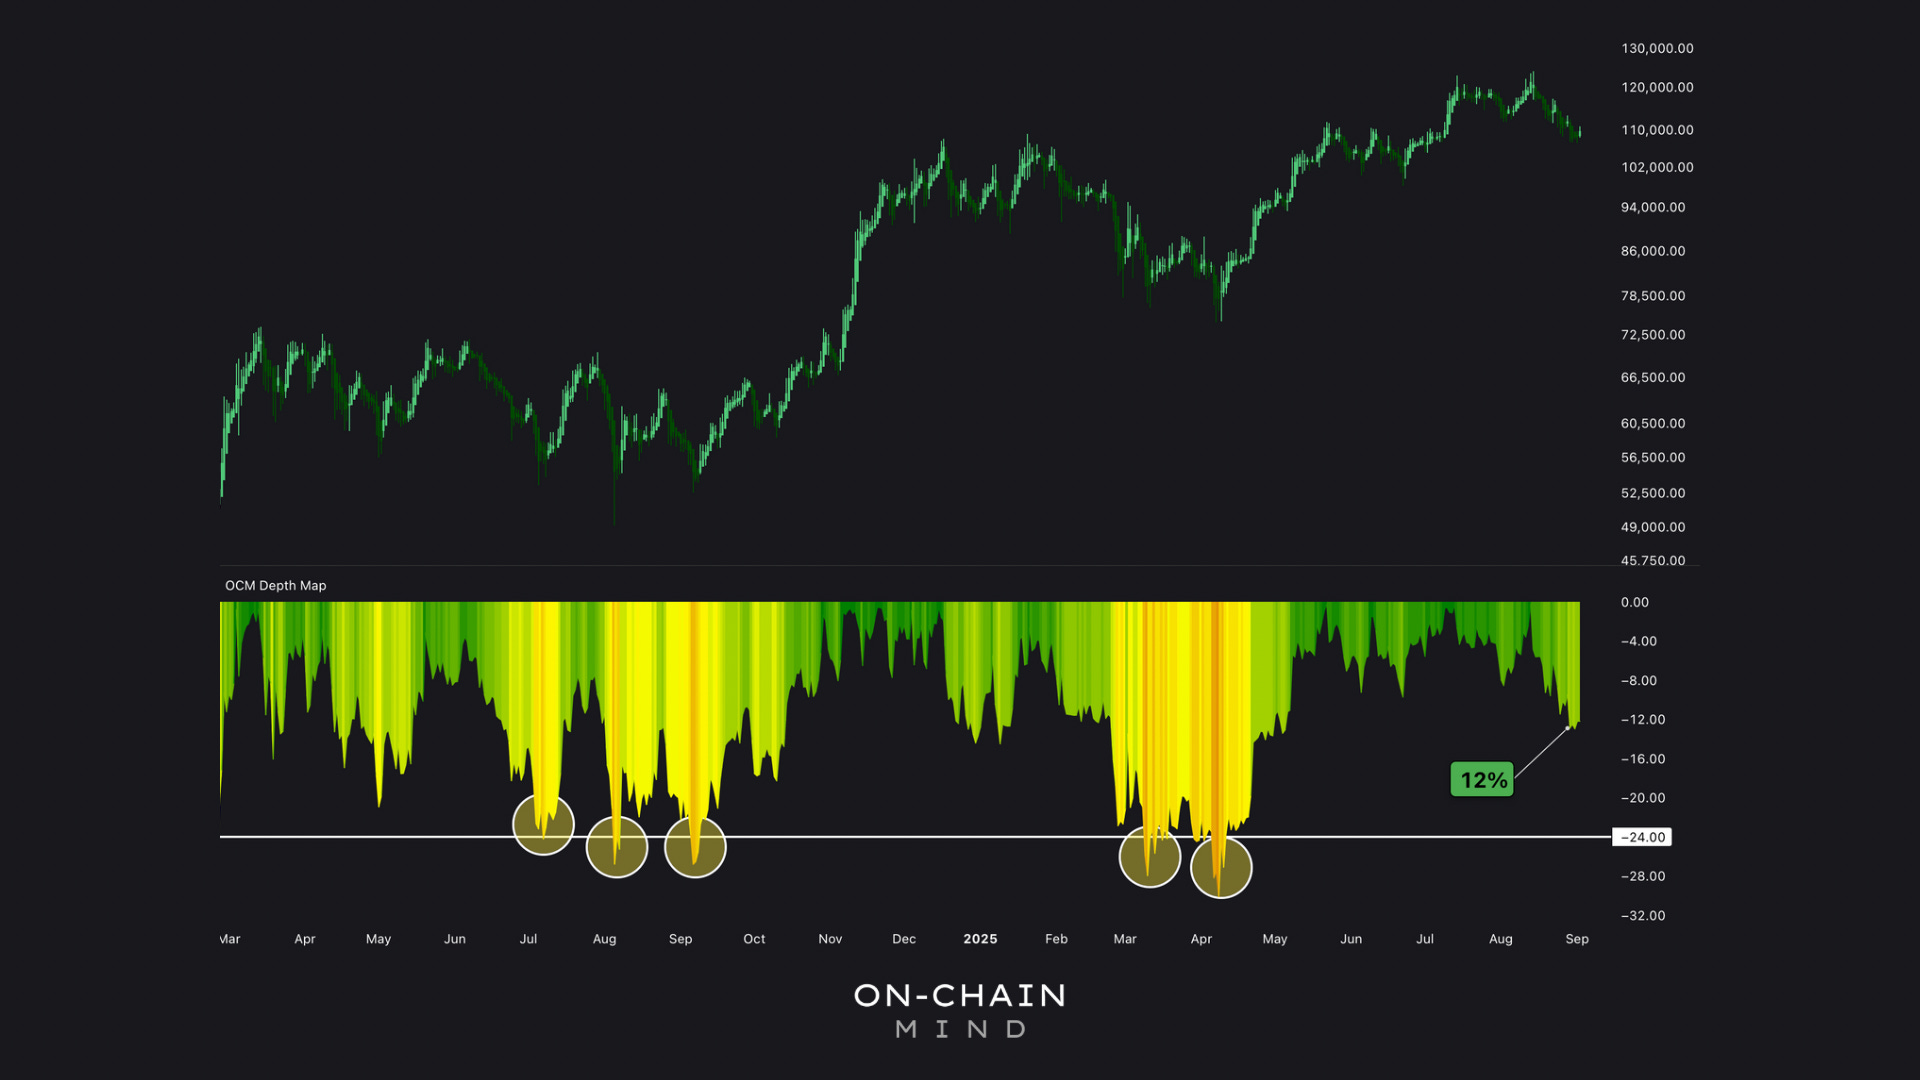
Today’s 12% correction is mild when compared to the last year and a half, which saw at least 5 corrections exceeding 24%. Despite the prevailing bearish sentiment online, the data shows Bitcoin has weathered much worse — and relatively recently.
Lessons from Previous Cycles
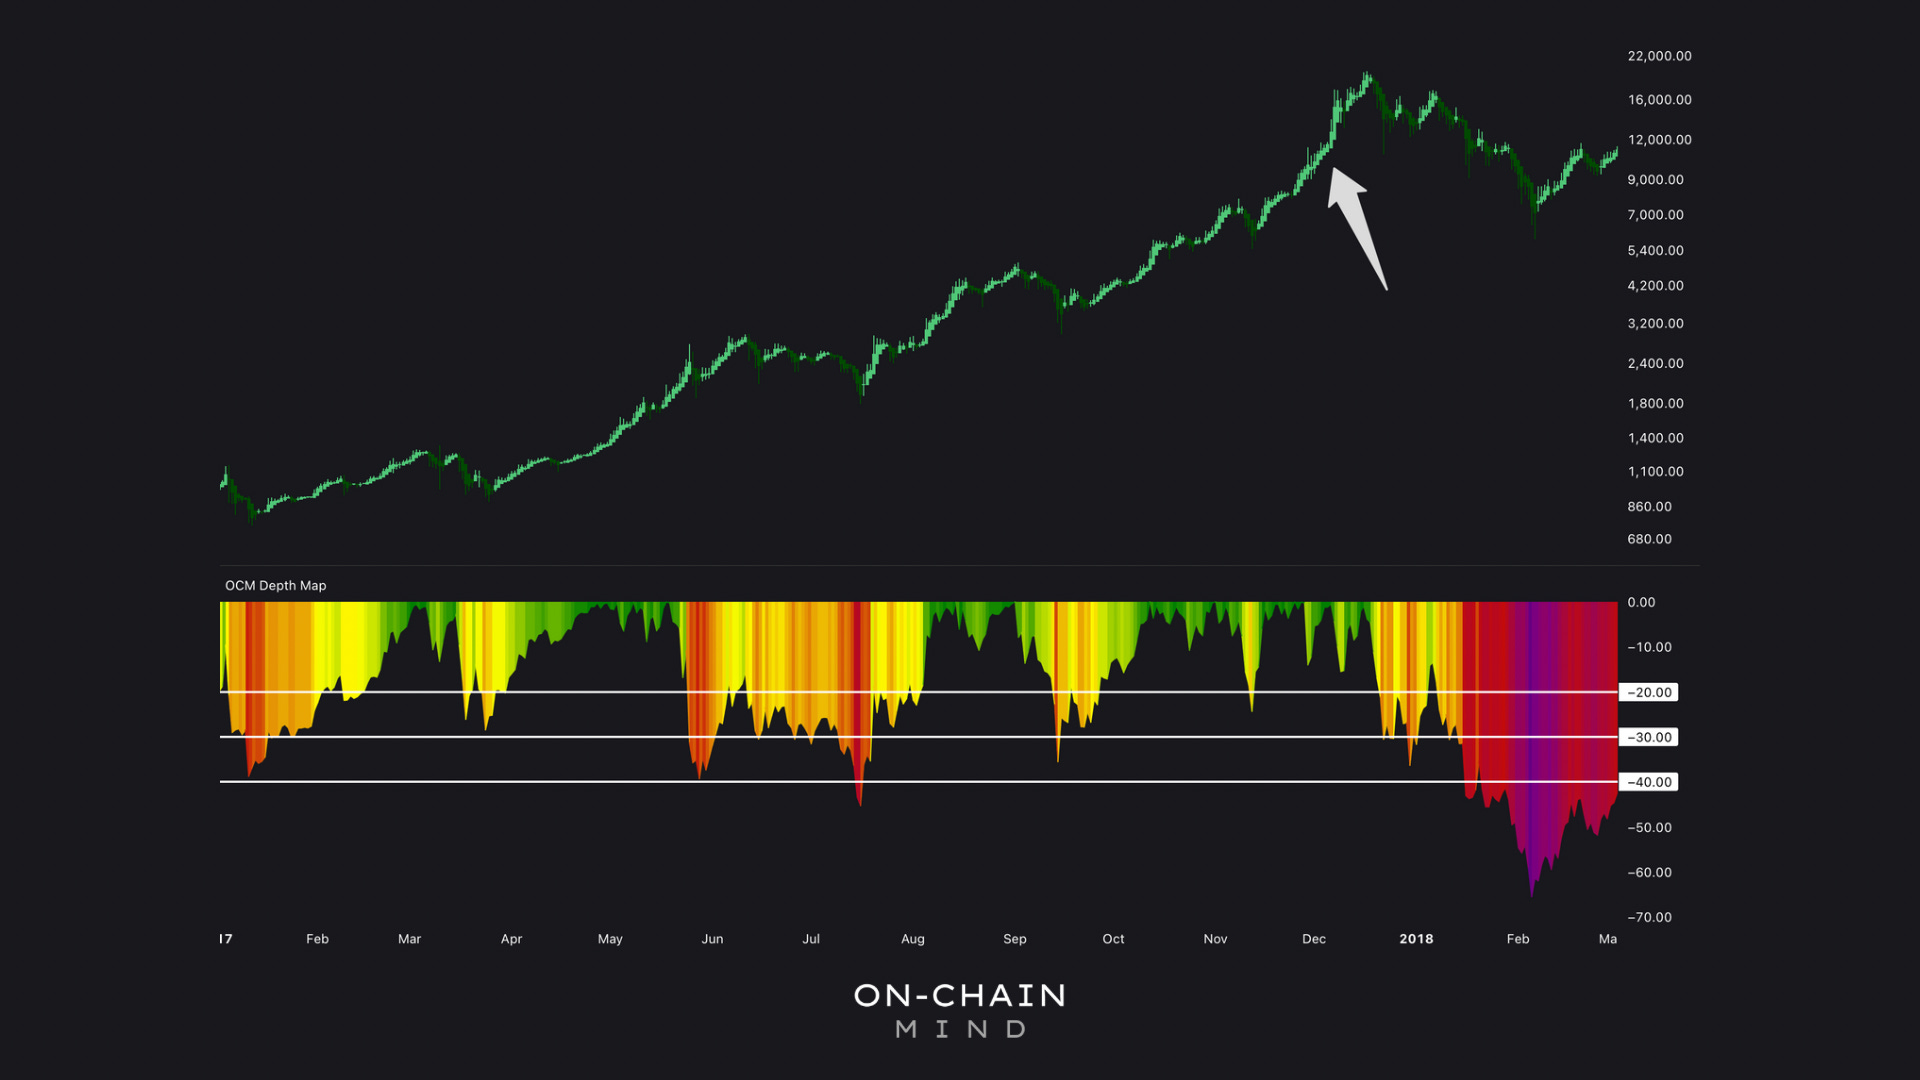
Comparing today’s market structure with prior cycles is key. A relevant comparison is the 2017 bull cycle, which also experienced a step-ladder style rise before the blow-off top. Here’s what happened back then:
Corrections of 20% were normal and occurred almost every month on the way up.
30% and even 40% pullbacks were observed before the market continued higher.
While Bitcoin has evolved into a larger and more institutionalised asset since 2017, volatility remains an intrinsic feature. In fact, during this current bull market alone, we’ve already witnessed multiple 20-30% corrections.
So would a further 30% drawdown surprise me? Not at all. This would take the price down to approximately $87,000, which is a level that, while seemingly bearish, is within historical norms.
From a personal perspective, such dips can be advantageous for net accumulators like myself. Lower prices create opportunities to accumulate more Bitcoin at attractive levels, while price increases expand overall wealth — they’re both good in my eyes. For investors with a 5–10-year horizon, these short-term fluctuations are largely irrelevant.
When Would I Turn Bearish?
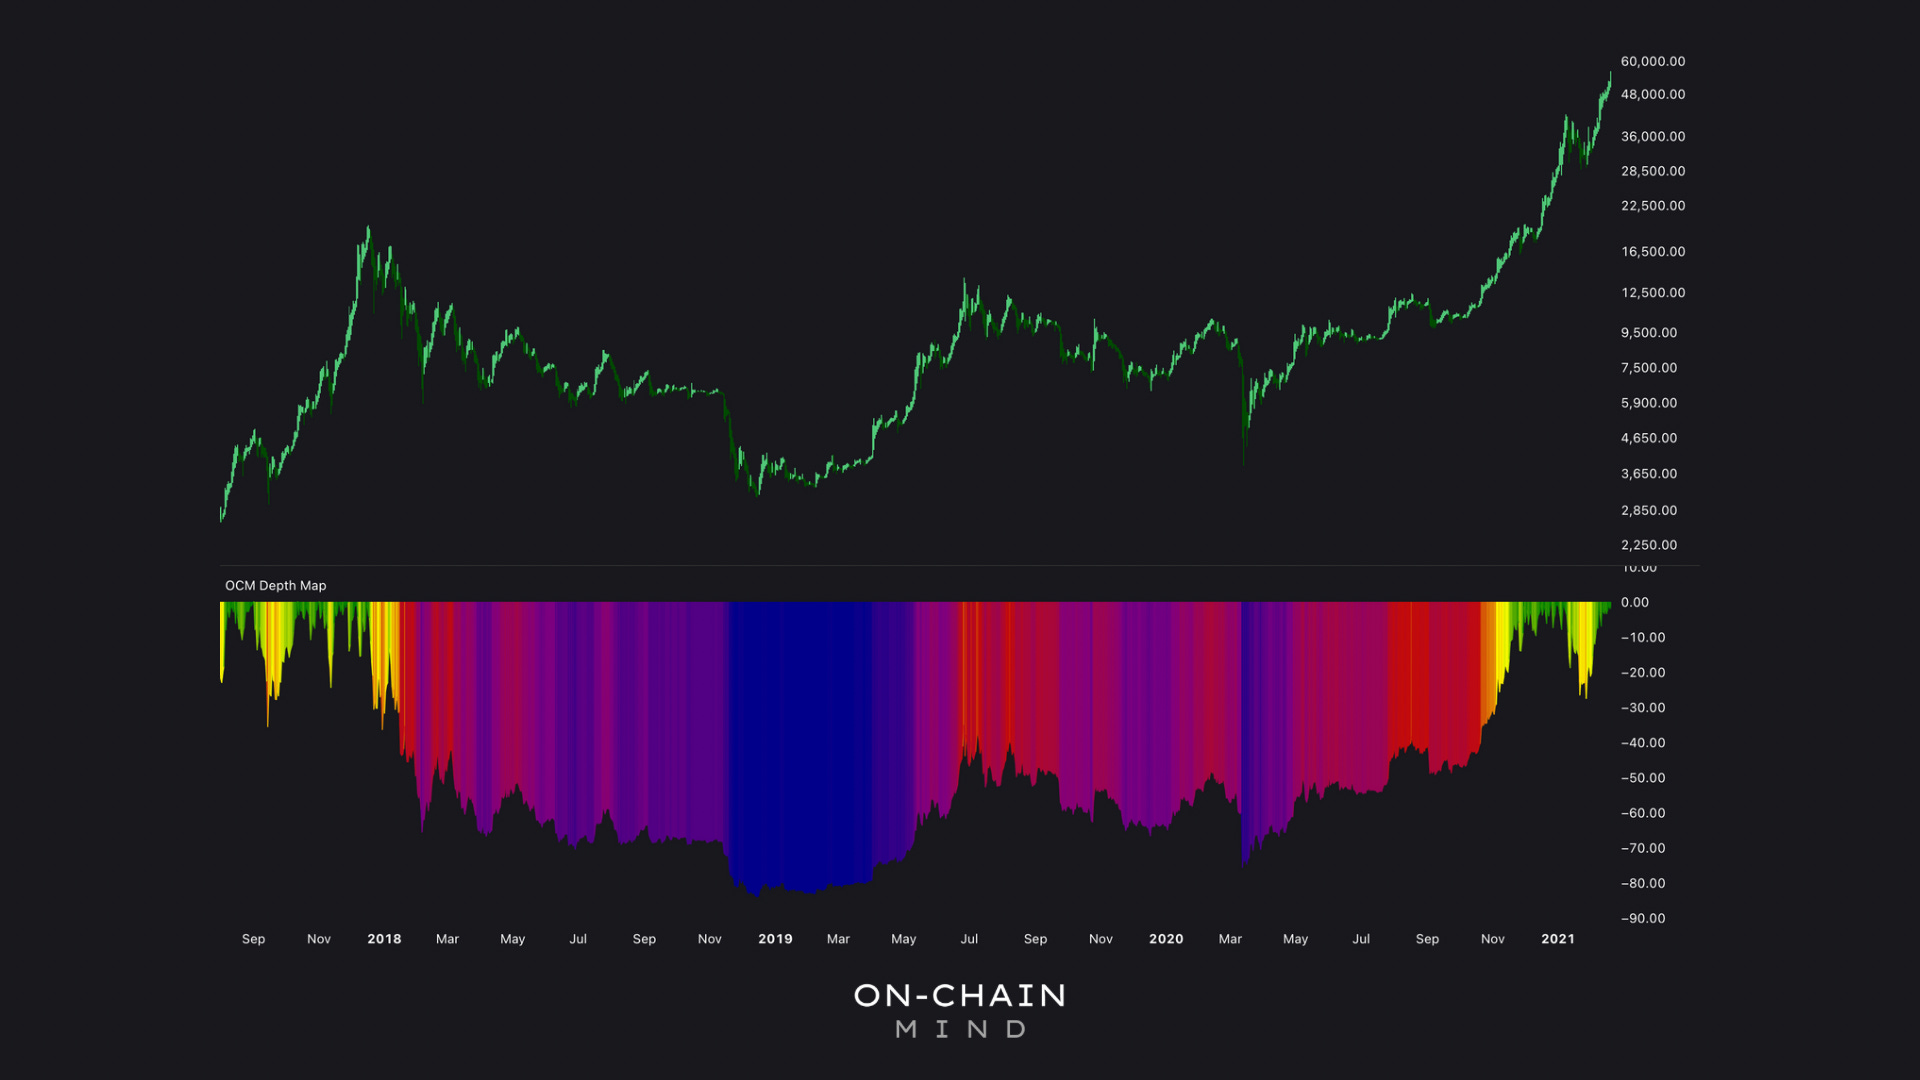
Corrections of 30–40% are not inherently bearish. History shows that markets only transition into prolonged bear phases when losses cascade beyond this point, such as after the 2018 blow-off top. At that time, recovery could take 2–3 years before a new all-time high was reached. See below.
Currently, as long as structural bullish trends remain intact, the market is still in a healthy state.
Key Levels I’m Watching
Short-Term Holder Realized Price
The short-term holder (STH) realized price measures the average acquisition cost for coins of recent investors (more specifically, for Bitcoin that was purchased within the past five months). It often acts as a psychological support:
Current STH realized price: $109,000
Price dipping below this level may induce impatience or panic selling among newer holders.
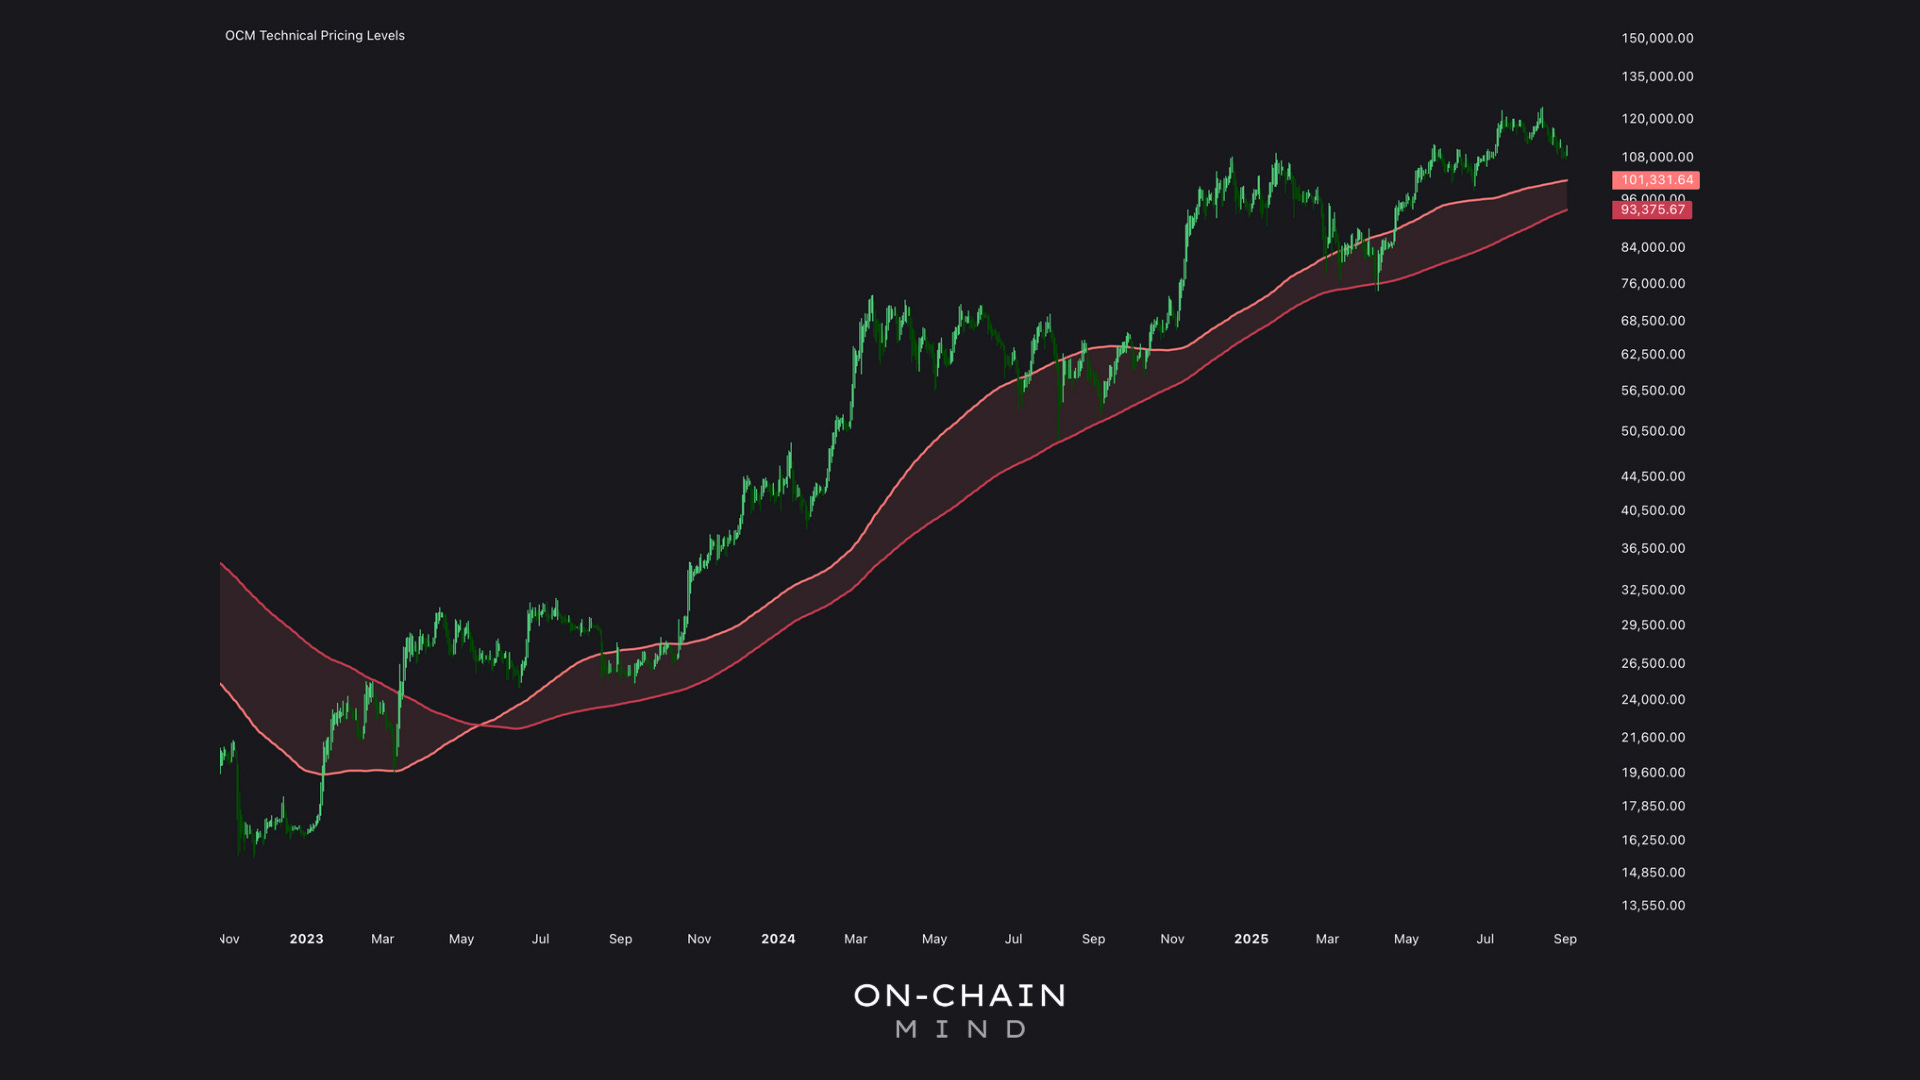
Deviation multiples, or my Cost Bands visualise how extended price is compared to this key level.
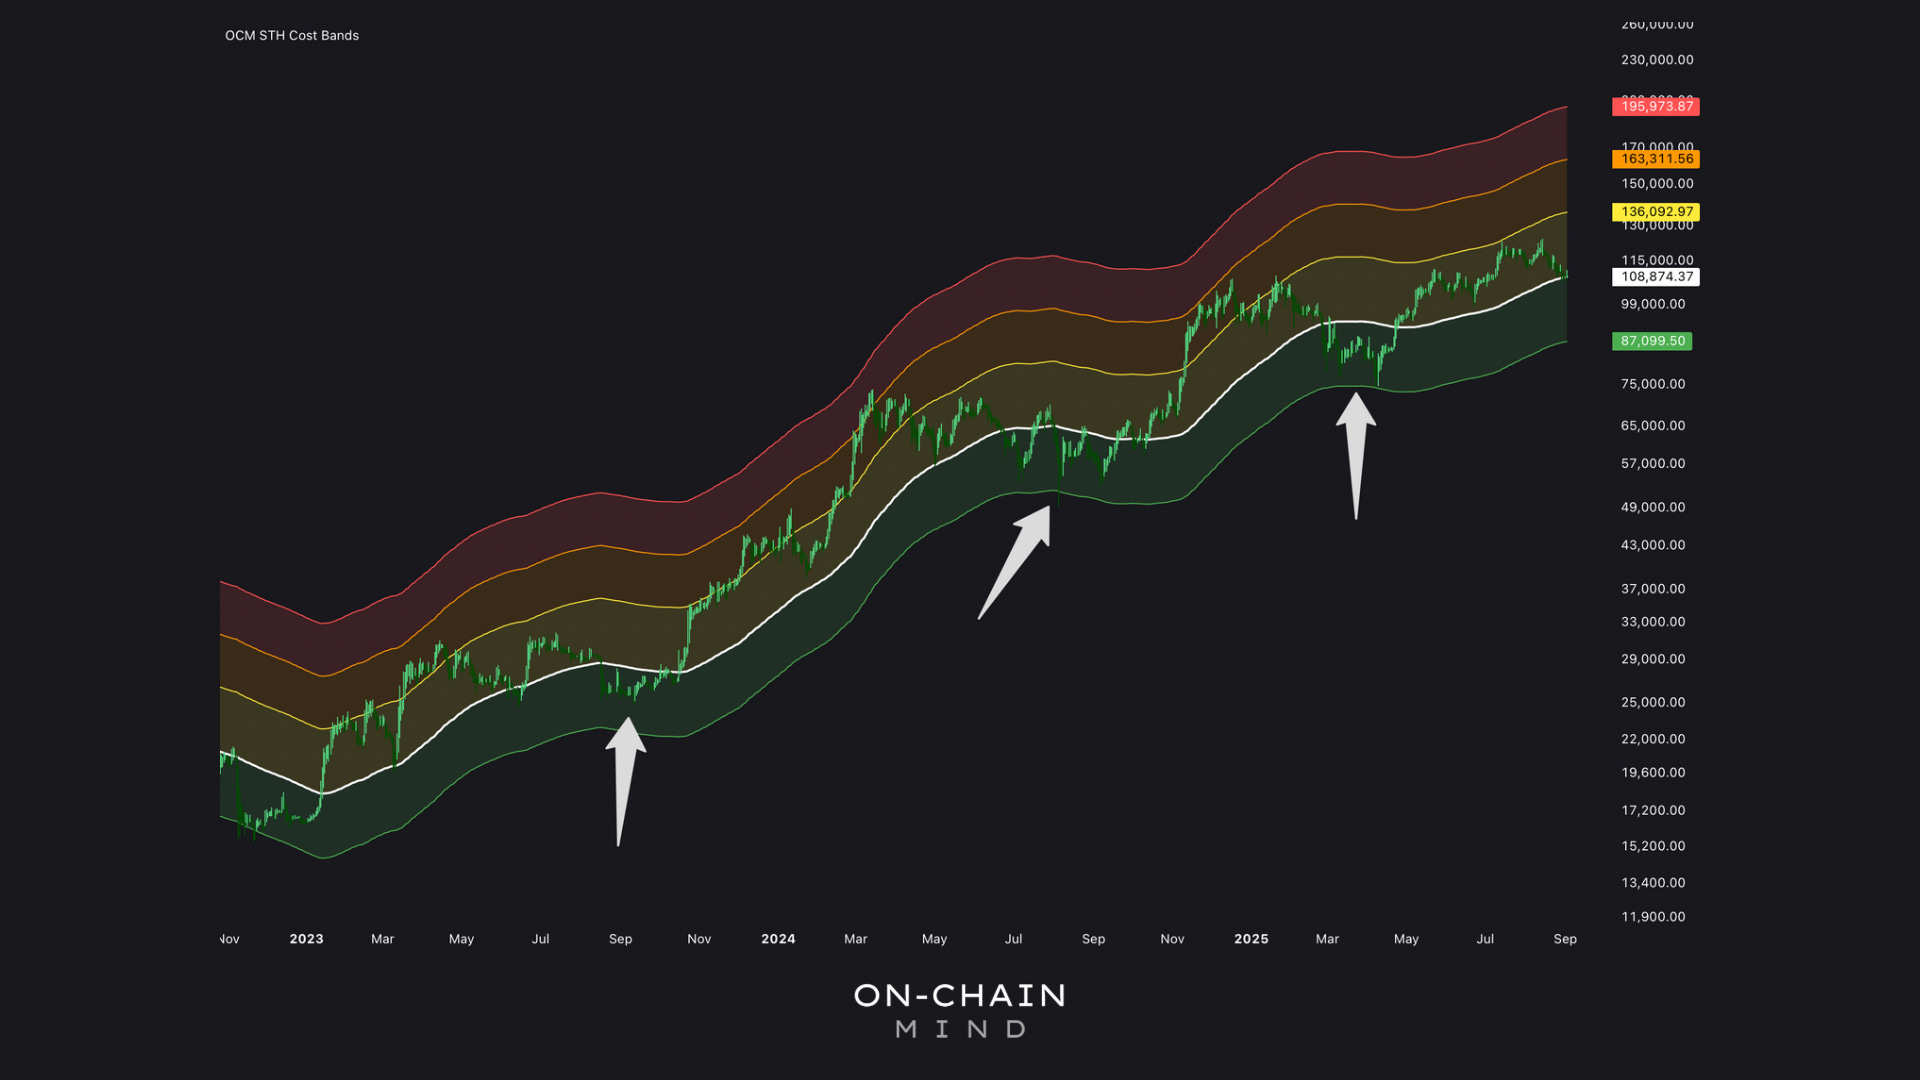
The green cost band, currently bottoming around $87,000 (funnily enough, the 30% ATH drawdown), signals the highest risk/reward accumulation zone. While the market may hover around this level for months, it typically precedes further upward momentum after the last hand is shaken out.
200-Day Moving Average
The 200-day moving average is a widely-followed technical level, often representing long-term trend support.
Current 200D MA: $101,000
Price testing this level signals a trend check but does not necessarily indicate market weakness.
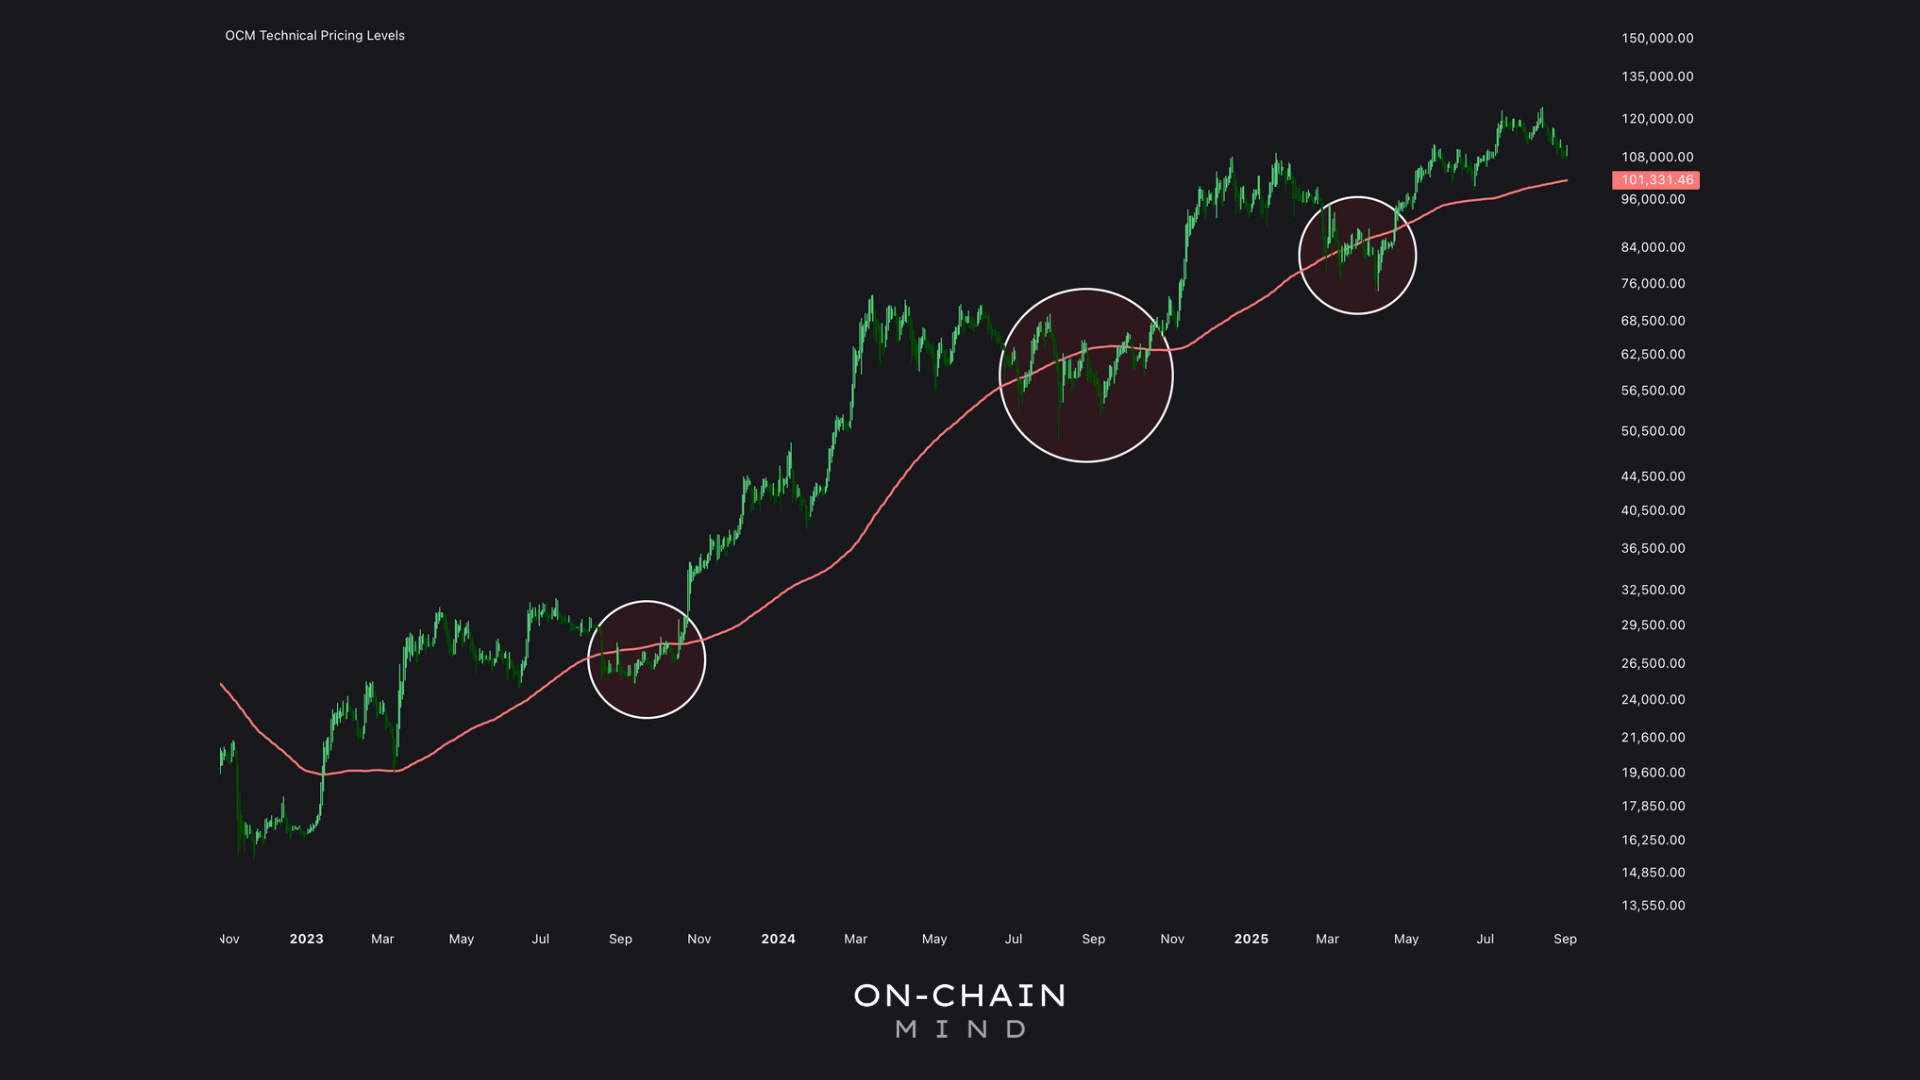
Statistically, in trending markets, prices revert to the mean. Psychologically, it’s a round-number magnet ($100,000 nearby adds allure). A breach here might fuel bearish narratives, but holding it — even with sideways chop — preserves bull structure.
365-Day Moving Average
For me, the yearly moving average defines the boundary between bull and bear markets.
Current 365-DMA: $93,000
A breach here would trigger reassessment of broader market health, particularly investor spending behaviour and cohort selling dynamics.
Assessing Investor Behaviour with SOPR
The Spent Output Profit Ratio (SOPR) measures the ratio between coins’ selling price and acquisition price:
SOPR > 1 (purple): Coins are sold at a profit.
SOPR < 1 (pink): Coins are sold at a loss, signalling capitulation.
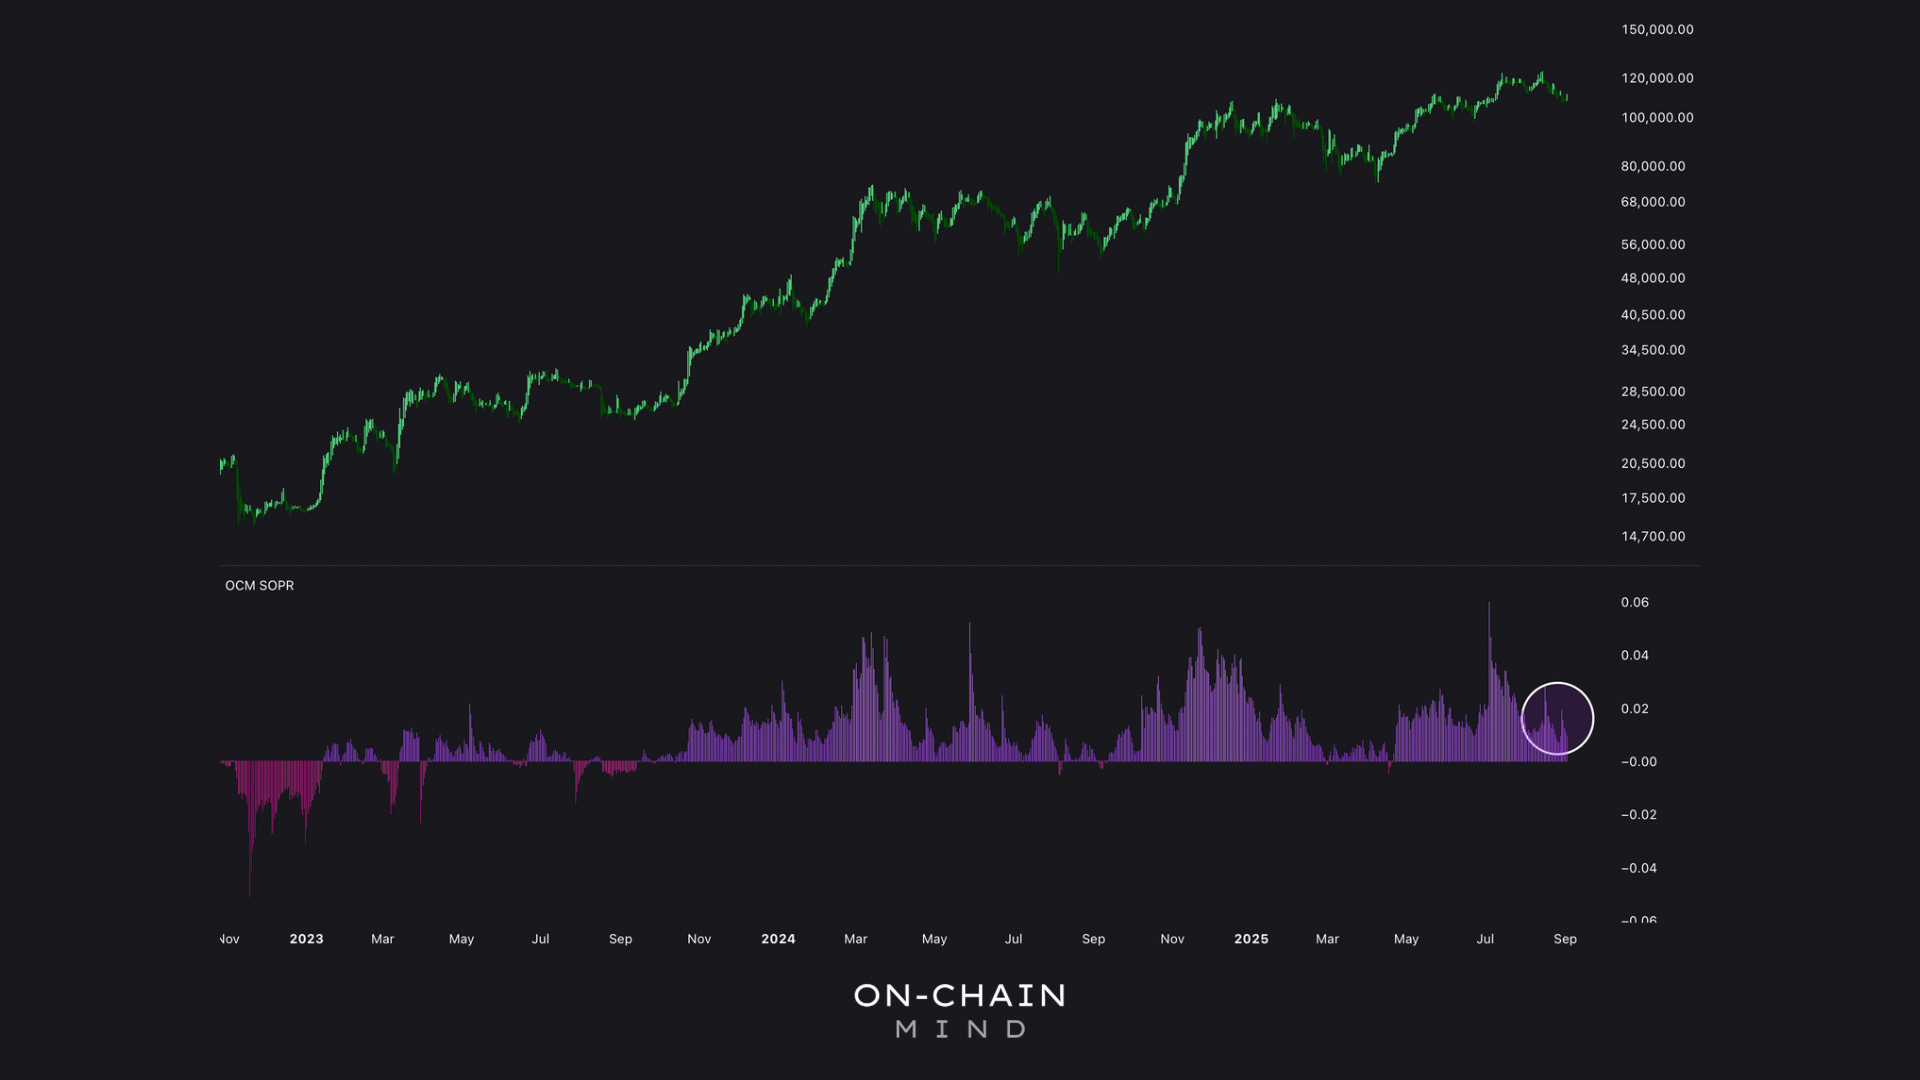
Currently, the 7-day moving average of SOPR remains positive, indicating active investors are realising gains, not losses. A deep pink signal alongside a test of the 365D MA would be a warning of potential structural market weakness.
Current Strategy and Mindset
Volatility is the cost of admission for holding Bitcoin.
Bitcoin’s journey rewards patience over reaction. Pullbacks of 20-40% are fixtures in every cycle, feeling acute yet appearing as blips when zoomed out. A 12% dip amid online hysteria? It’s par for the course.
While a deeper correction is always possible, instead of fretting, monitor the key price levels:
STH realized price: psychological support at $109,000
200-day moving average: trend check at $101,000
365-day moving average: bull/bear threshold at $93,000
Holding these maintains bullish integrity, despite the sentiment fluctuations you’ll read. From a structural perspective, the bullish trend remains intact and the market’s bigger picture hasn’t changed. Pullbacks are just part of the journey up, and the trend is your friend until proven otherwise.
Key Takeaways
Volatility is Inevitable and Beneficial: Expect 20-40% corrections in bull markets; they reset the system and create accumulation opportunities without derailing long-term trends.
Monitor Critical Support Levels: The STH realized price, 200-day MA, and yearly MA serve as benchmarks — holding them signals continued bullishness.
Data Over Sentiment: Metrics like SOPR reveal true market health, showing no capitulation yet, which supports a healthy bull structure.
Long-Term Mindset Wins: Shift from fearing dips to embracing them as discounts, aligning with Bitcoin’s asymmetrical risk profile for sustained wealth building.
If you want to unlock the full picture — including access to my Custom Indicator Suite — consider upgrading to Premium 🚀
I’ll catch you in the next one.
Cheers,
OCM
🎥 Watch the video of this article on YouTube!👇🏼
Subscribe to the On-Chain Mind YouTube Channel!