


Bitcoin Follows These Liquidity Signals
How Year-on-Year Liquidity Derivatives Predict Bitcoin Rallies/Crashes with Surprising Accuracy

Hey everyone, and welcome back to the On-Chain Mind Newsletter.
Over the past year or so, even your average crypto bro has finally clocked on to one of the most powerful forces behind Bitcoin’s price action: global liquidity. And while many still cling to narratives like the 4-year halving cycle, it’s becoming increasingly obvious that Bitcoin’s USD valuation is deeply tethered to how much capital is sloshing around the global economy.
The tides of global money supply have dictated the rise and fall of asset prices since the dawn of the fiat era. But how can we use this relationship to sharpen our investing edge? This article explores a set of custom-built metrics that I’ve designed to decode Bitcoin’s correlation with liquidity and I’m pretty sure you won’t find them anywhere else. It’s time to stop guessing, and start measuring.
Let’s get into it.
Insights at a Glance:
Global Liquidity is a Market Driver: Bitcoin’s price movements closely track global liquidity, particularly the M2 money supply, with a 2-3 month lag.
Advanced Metrics for Precision: Custom indicators like the Liquidity Correlation Index and Liquidity Dislocation Index reveal when Bitcoin’s price diverges from liquidity trends, signalling potential opportunities or risks.
Historical Patterns Inform Future Moves: Moments of disconnection between Bitcoin and liquidity growth often precede significant rallies or warn of market tops.
Long-Term Perspective: Bitcoin’s current undervaluation relative to expanding liquidity suggests a potential catch-up rally in the coming months.
The Fuel for Financial Markets
To grasp Bitcoin’s relationship with global liquidity, we first need to understand what liquidity represents. Global liquidity isn’t a single, tidy figure but a complex amalgamation of money supply metrics that reflect how much capital is circulating in the global economy. This capital fuels spending, investment, and, crucially, asset price movements, including Bitcoin. Among the various metrics, M2 is the most widely referenced. It encompasses:
Physical cash
Checking accounts
Savings accounts
Small-time deposits
Essentially, money that’s readily accessible for spending or investing. Unlike M0, which is strictly physical cash, or the broader M3, which includes institutional funds but is no longer reliably reported by the U.S. Federal Reserve since 2006, M2 offers a practical snapshot of liquid capital, particularly for consumers and smaller investors.
Why does this matter for Bitcoin?
In a financial system increasingly reliant on credit and leverage, central banks’ policies of money creation or “debasement” drive asset prices upward. Bitcoin, with its fixed supply of 21 million coins, stands in stark contrast to fiat currencies subject to infinite printing. To contextualise, consider the global financial system’s reliance on debt and money creation. Since the 2008 financial crisis, central banks have leaned heavily on the money printer, injecting trillions into economies to “stimulate growth”. This has led to an unprecedented expansion of money supply, with M2 in major economies like the U.S., EU, and China growing rapidly. For Bitcoin, this creates a tailwind: as fiat money loses purchasing power, Bitcoin’s fixed supply becomes the ultimate hedge against inflation. However, liquidity doesn’t move in a straight line. It ebbs and flows, creating cycles that Bitcoin tends to follow with stunning accuracy.
The M2 Liquidity Chart
The relationship between Bitcoin and global liquidity is most evident in the M2 global liquidity chart, a staple in recent crypto macro analysis. This chart plots Bitcoin’s price against global M2 money supply, typically with a 2-3 month lag to account for the time it takes for liquidity changes to influence the market. Bitcoin’s major price movements (both uptrends and downturns) often mirrors M2 growth with remarkable consistency.
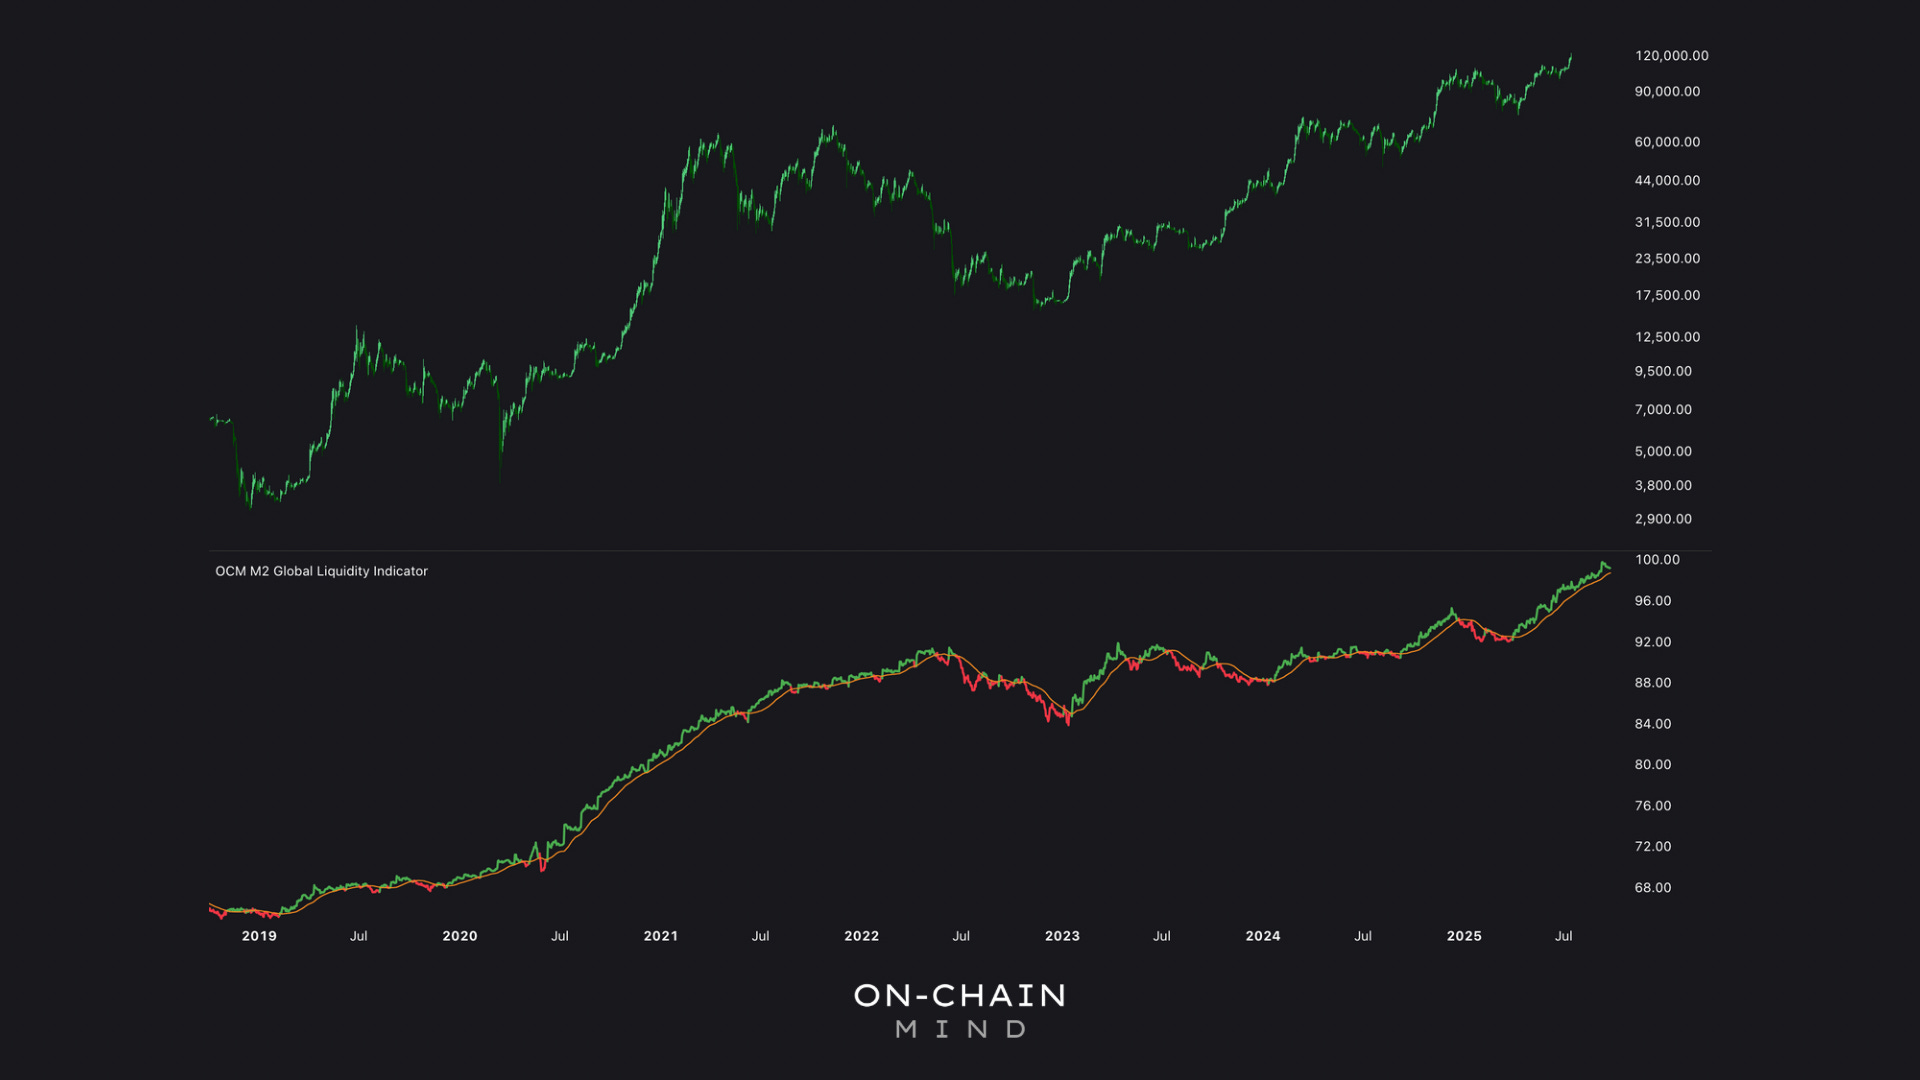
For instance, during the 2020–2021 bull run, global M2 surged as governments unleashed massive stimulus packages to counter the COVID-19 economic fallout. Bitcoin, after a brief lag, skyrocketed from $10,000 to nearly $69,000 by November 2021. Conversely, when liquidity growth reversed in 2022, Bitcoin entered a bear market, bottoming out around $16,000.
The Year-on-Year Δ
While the M2 chart provides a reliable macro view, it has limitations. Its long-term trend is “up and to the right”, reflecting the relentless growth of money supply in modern economies. This aligns with Bitcoin’s long-term bullish trend but obscures shorter-term fluctuations. To address this, we can refine our approach by examining the year-on-year Δ in M2 (the percentage change in money supply over the past 12 months), to highlight whether liquidity is accelerating or decelerating.
Key Observations from the M2 YoY Δ
Cycle Peaks and Liquidity Booms: Historical data shows that Bitcoin’s bull market peaks often coincide with rapid increases in M2 year-on-year growth, as seen in 2017 and 2021.

Bear Market Bottoms: Contractions in liquidity, like the one in 2022, signal potential market bottoms, as reduced capital flow starves risk assets like Bitcoin.
Current Trend: With M2 growth at 8% year-on-year, liquidity is expanding steadily, indicating Bitcoin is not yet at a cycle peak but may be gearing up for one.

The Liquidity Correlation Index
Let’s take this a step deeper. Introducing a custom metric: the Liquidity Correlation Index (or LCI), which measures how closely Bitcoin’s year-on-year price growth aligns with M2 liquidity growth over a 3 month window. When the LCI is high (displayed as light grey), Bitcoin and liquidity YoY are moving in lockstep. However, when the LCI dips and flashes a bright teal colour, it signals a divergence — either Bitcoin outpacing liquidity or vice versa.
