

Bitcoin Market Cycles Decoded
2 Tools to Navigate Crypto Tops and Bottoms

Hey everyone, and welcome back to the On-Chain Mind Newsletter.
Bitcoin’s price fluctuations aren’t random. They follow cycles of booms and busts. In this article, I’m going to break down two important metrics that could help you identify when Bitcoin is undervalued (a great time to buy) and when it’s overheated (a sensible time to take profits).
Let’s get into it.
Insights at a Glance:
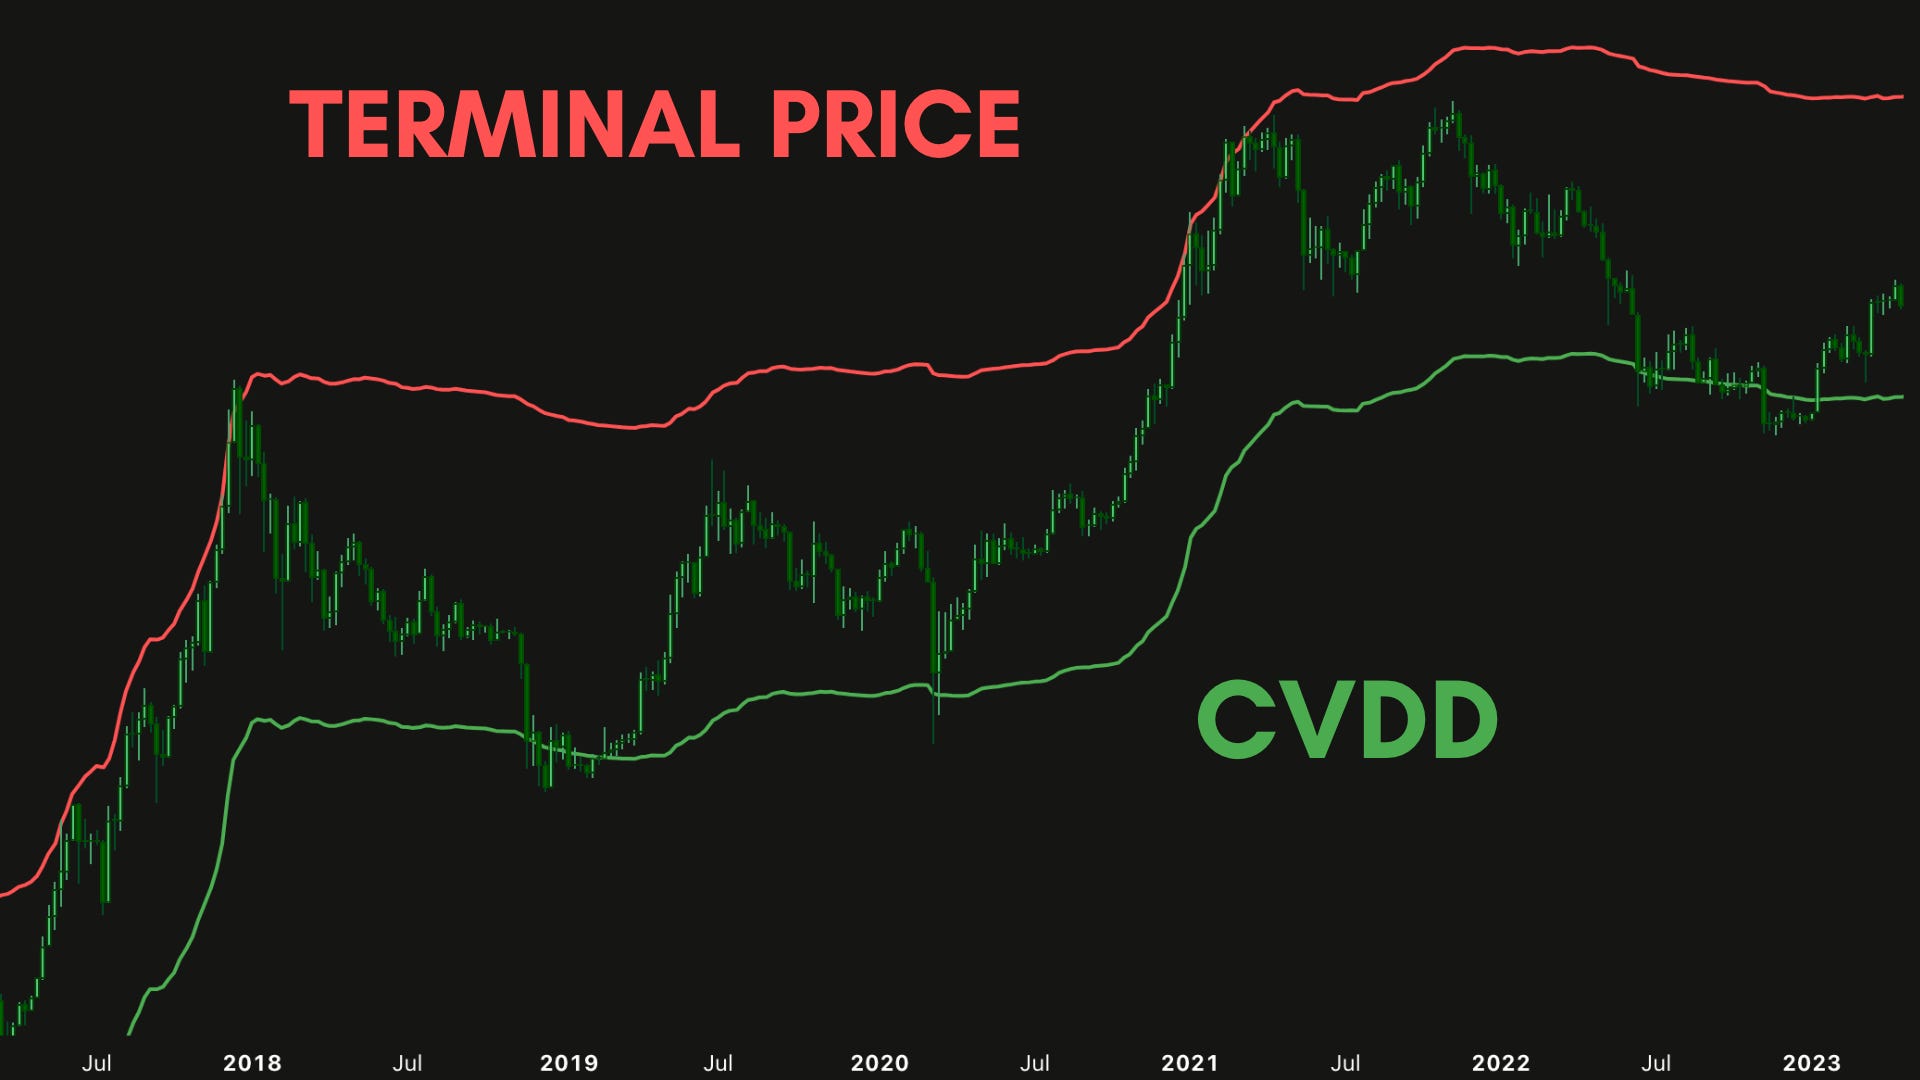
The Cumulative Value of Coin Days Destroyed (CVDD) helps identify market bottoms, signalling undervaluation and strong buying opportunities.
The Terminal Price serves as Bitcoin’s long-term price ceiling, helping investors recognise speculative peaks.
Bitcoin oscillates between these two levels, creating clear market cycles that repeat over time.
A dynamic dollar-cost averaging (DCA) strategy works — timing the market perfectly is less important than adopting a flexible, long-term approach.
Why Bitcoin’s Price Moves in Cycles
Bitcoin’s price tends to follows distinct cycles of growth and decline. From trading at pennies at the beginning, to its meteoric blow-off top rises (like $20,000 in 2017 or $69,000 in 2021). Bitcoin has a knack for testing an investor’s patience whilst also driving extreme FOMO. Zoom out on its price chart, and you’ll see a pattern: periods of explosive growth followed by sharp corrections, often repeating over months or years. But what drives these cycles?
At its core, Bitcoin’s price reflects a tug-of-war between supply, demand, and human psychology. Its fixed supply of 21 million coins creates scarcity, while market sentiment, fear, greed, and everything in between—fuels the booms and busts. The challenge for investors is knowing when the market is overheated or hitting rock bottom. That’s where these two tools come in: the Cumulative Value of Coin Days Destroyed (CVDD) and the Terminal Price.
Bitcoin’s price history shows a clear pattern:
During bear markets, it tends to hover near its CVDD line, marking a period of extreme fear and undervaluation.
During bull markets, it climbs toward its Terminal Price, where speculation is at its peak.
Let’s break them down one by one.
Cumulative Value of Coin Days Destroyed (CVDD)
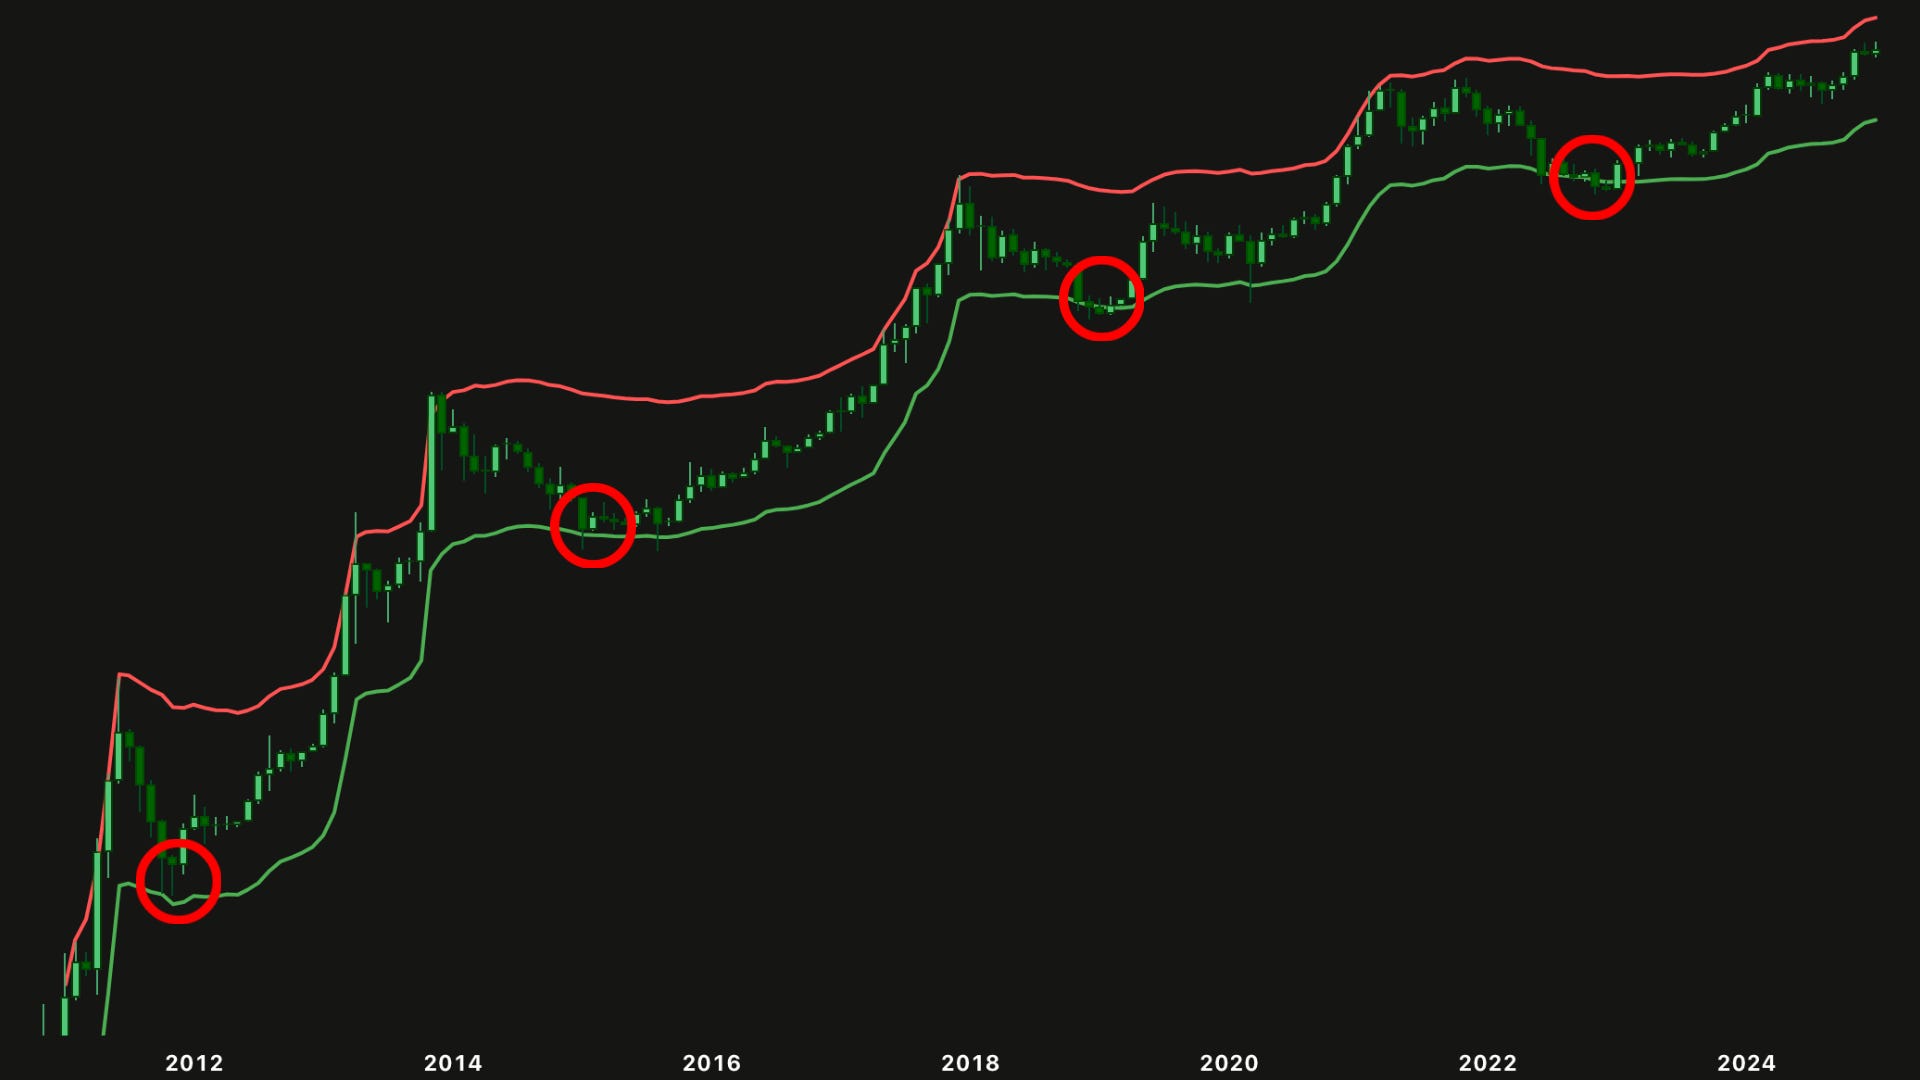
The CVDD, or Cumulative Value of Coin Days Destroyed, is a metric that helps identify when Bitcoin is undervalued. It tracks how long Bitcoin has been held before being moved and assigns weight based on the age of the coins being transacted.
Specifically, it measures something called “coin days destroyed”—a metric that captures how long coins have been held before they’re moved. When a Bitcoin sits untouched in a wallet for, say, 100 days and is then transferred, 100 coin days are “destroyed”. The CVDD takes this idea, sums it up over time, and adjusts it to reflect Bitcoin’s market age.
Here’s the simplified formula:
When Bitcoin’s price drops to the CVDD line, it’s often a sign of panic selling or even total capitulation. Historically, these moments have marked prime buying opportunities. The CVDD has consistently flagged undervaluation across Bitcoin’s history.
The Psychology Behind the CVDD
So why does it work so well? Well, when long-held coins start moving, it often means seasoned holders are cashing out, sometimes at a loss. This “shakeout” clears the market of weak hands, setting the stage for a recovery. It has repeatedly proven effective at pinpointing Bitcoin’s lowest risk buying opportunities. For those who understand this pattern, it’s one of the best times to accumulate Bitcoin.
Terminal Price
This metric offers a theoretical ceiling for Bitcoin’s value, based on its ultimate supply cap of 21 million coins. In essence, it’s the price Bitcoin might stabilize at once all coins are mined and circulating—a long-term “fair value” upper boundary.
The calculation builds on the CVDD:
Terminal Price is derived from the transferred price, which considers the economic activity of Bitcoin holders over time. It then scales this value up to reflect the full supply of 21 million coins.
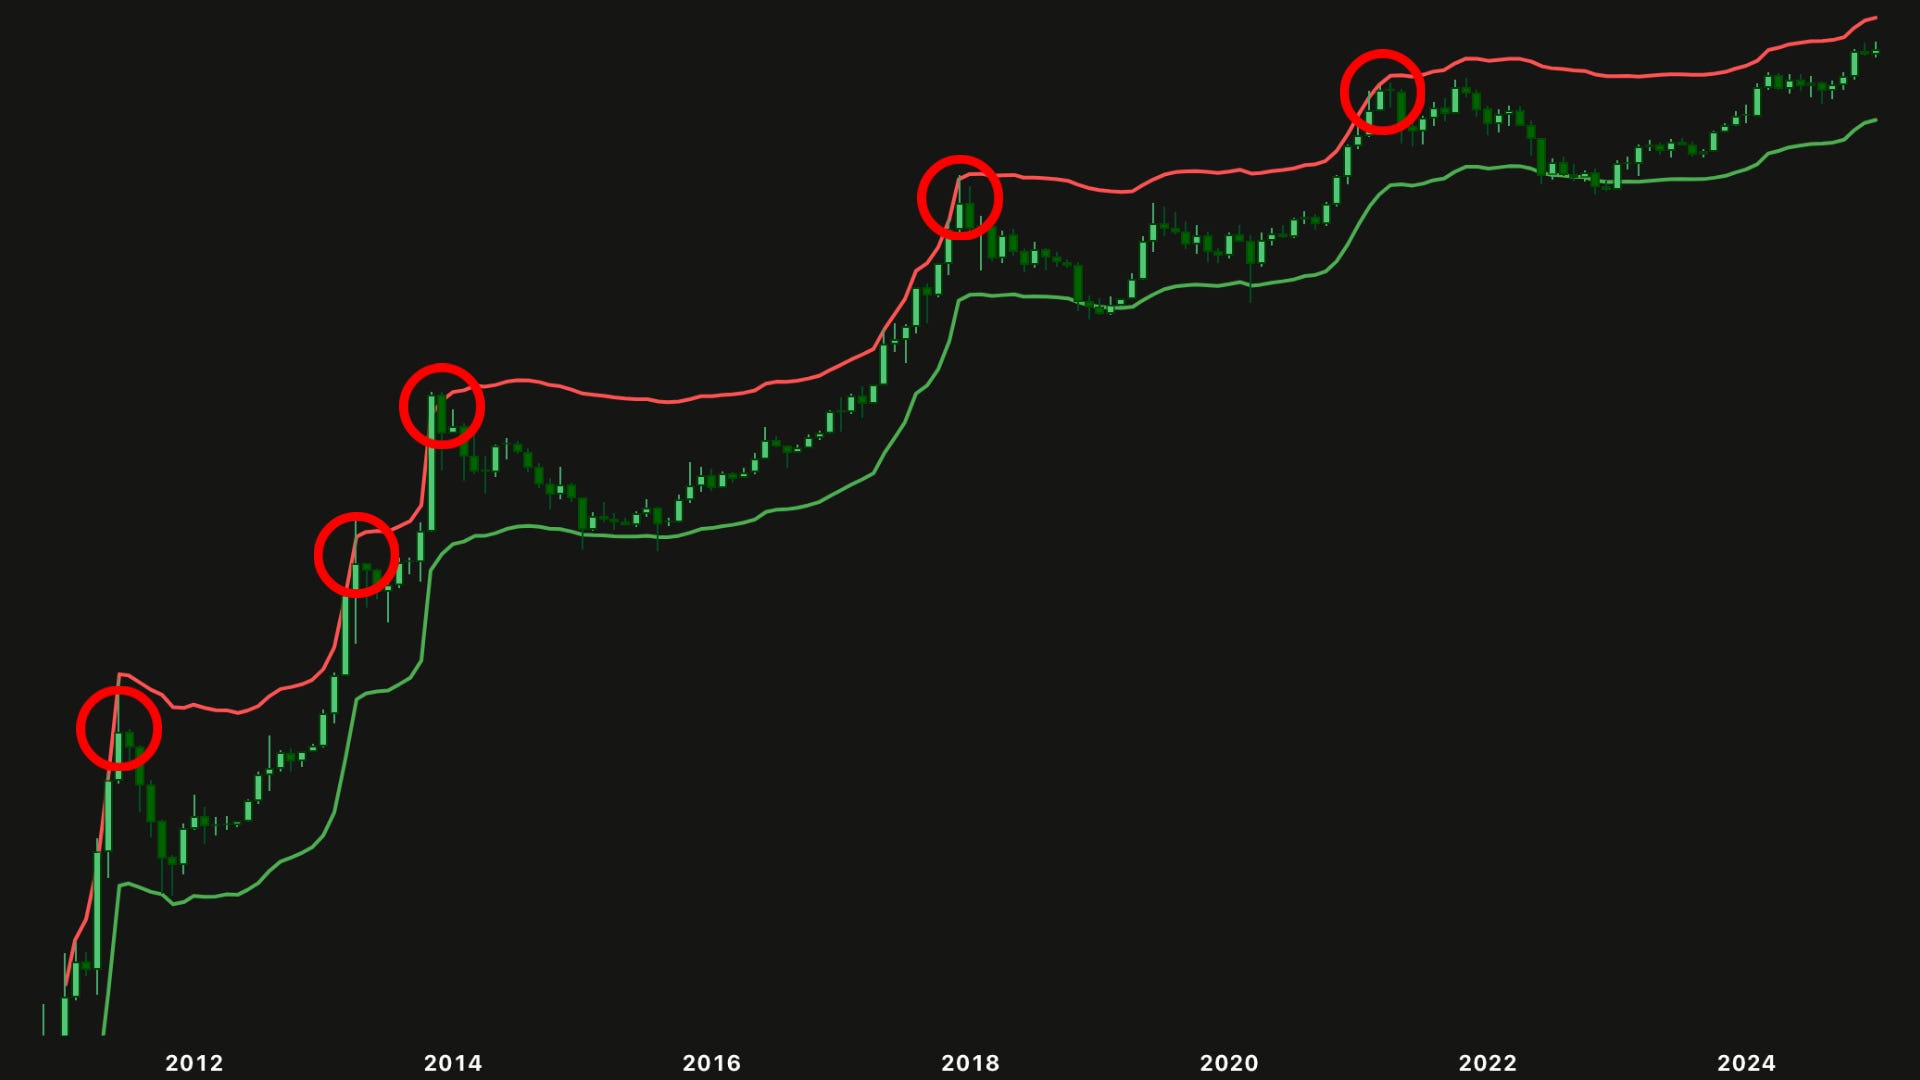
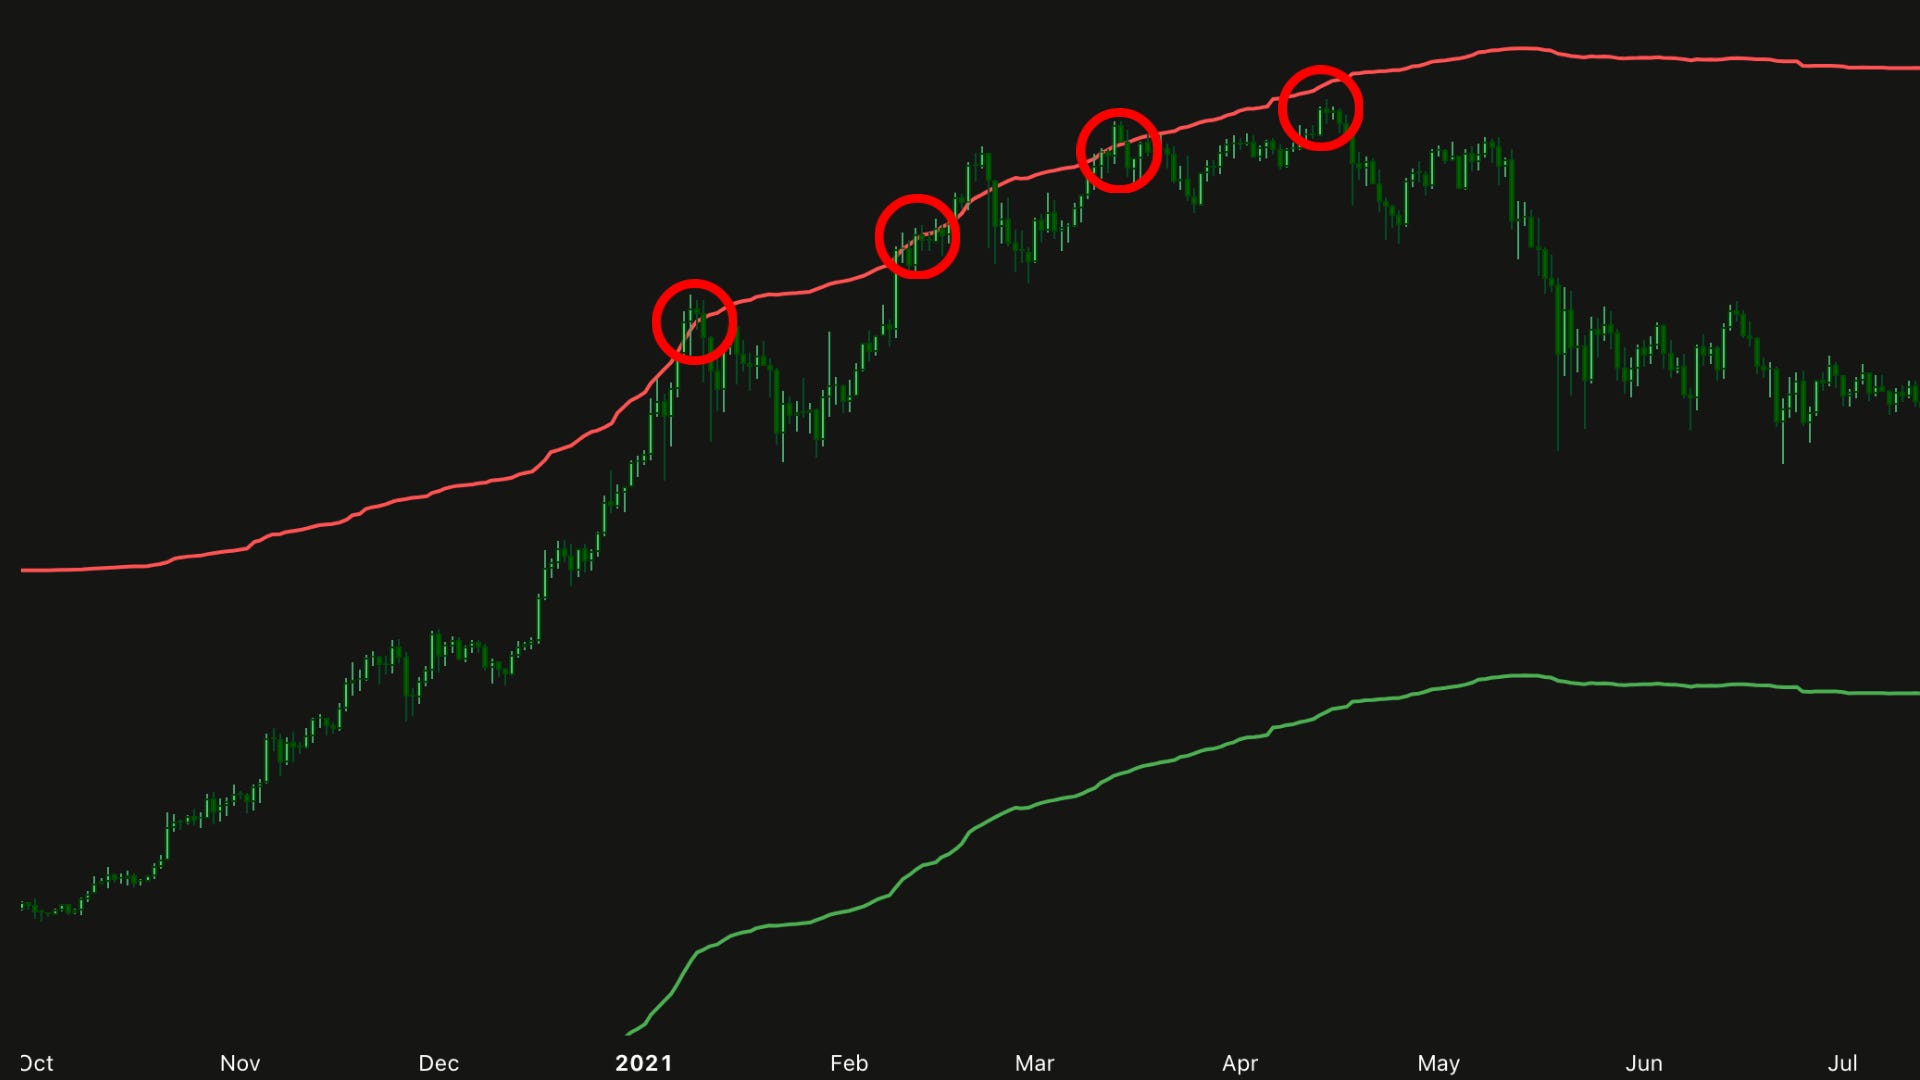
When Bitcoin’s price climbs to the Terminal Price, it’s often a signal that the market is overheating. In 2021, Bitcoin repeatedly touched or hovered near this line as major resistance as it soared to $69,000. Each touch reflected growing euphoria—new investors piling in, media hype, and FOMO. But historically, these peaks don’t last; they’re followed by corrections as the market cools off.
Supply Dynamics at Play
The Terminal Price ties directly to Bitcoin’s scarcity. As more coins are mined (we’re at about 19.5 million as of April 2025), the issuance rate slows due to halving events—those quadrennial moments when mining rewards drop by half. This tightening supply, paired with surging demand, drives prices toward the Terminal Price during bull cycles. It’s a reminder that Bitcoin’s value isn’t just about hype; it’s rooted in its programmed economics.
Actionable Tip — Hitting the Terminal Price doesn’t mean “sell everything now”. Prices can overshoot or linger near this level for weeks. Use it as a cue to reassess your position—perhaps take partial profits or tighten your risk management—rather than trying to nail the exact top.
The Oscillation Pattern
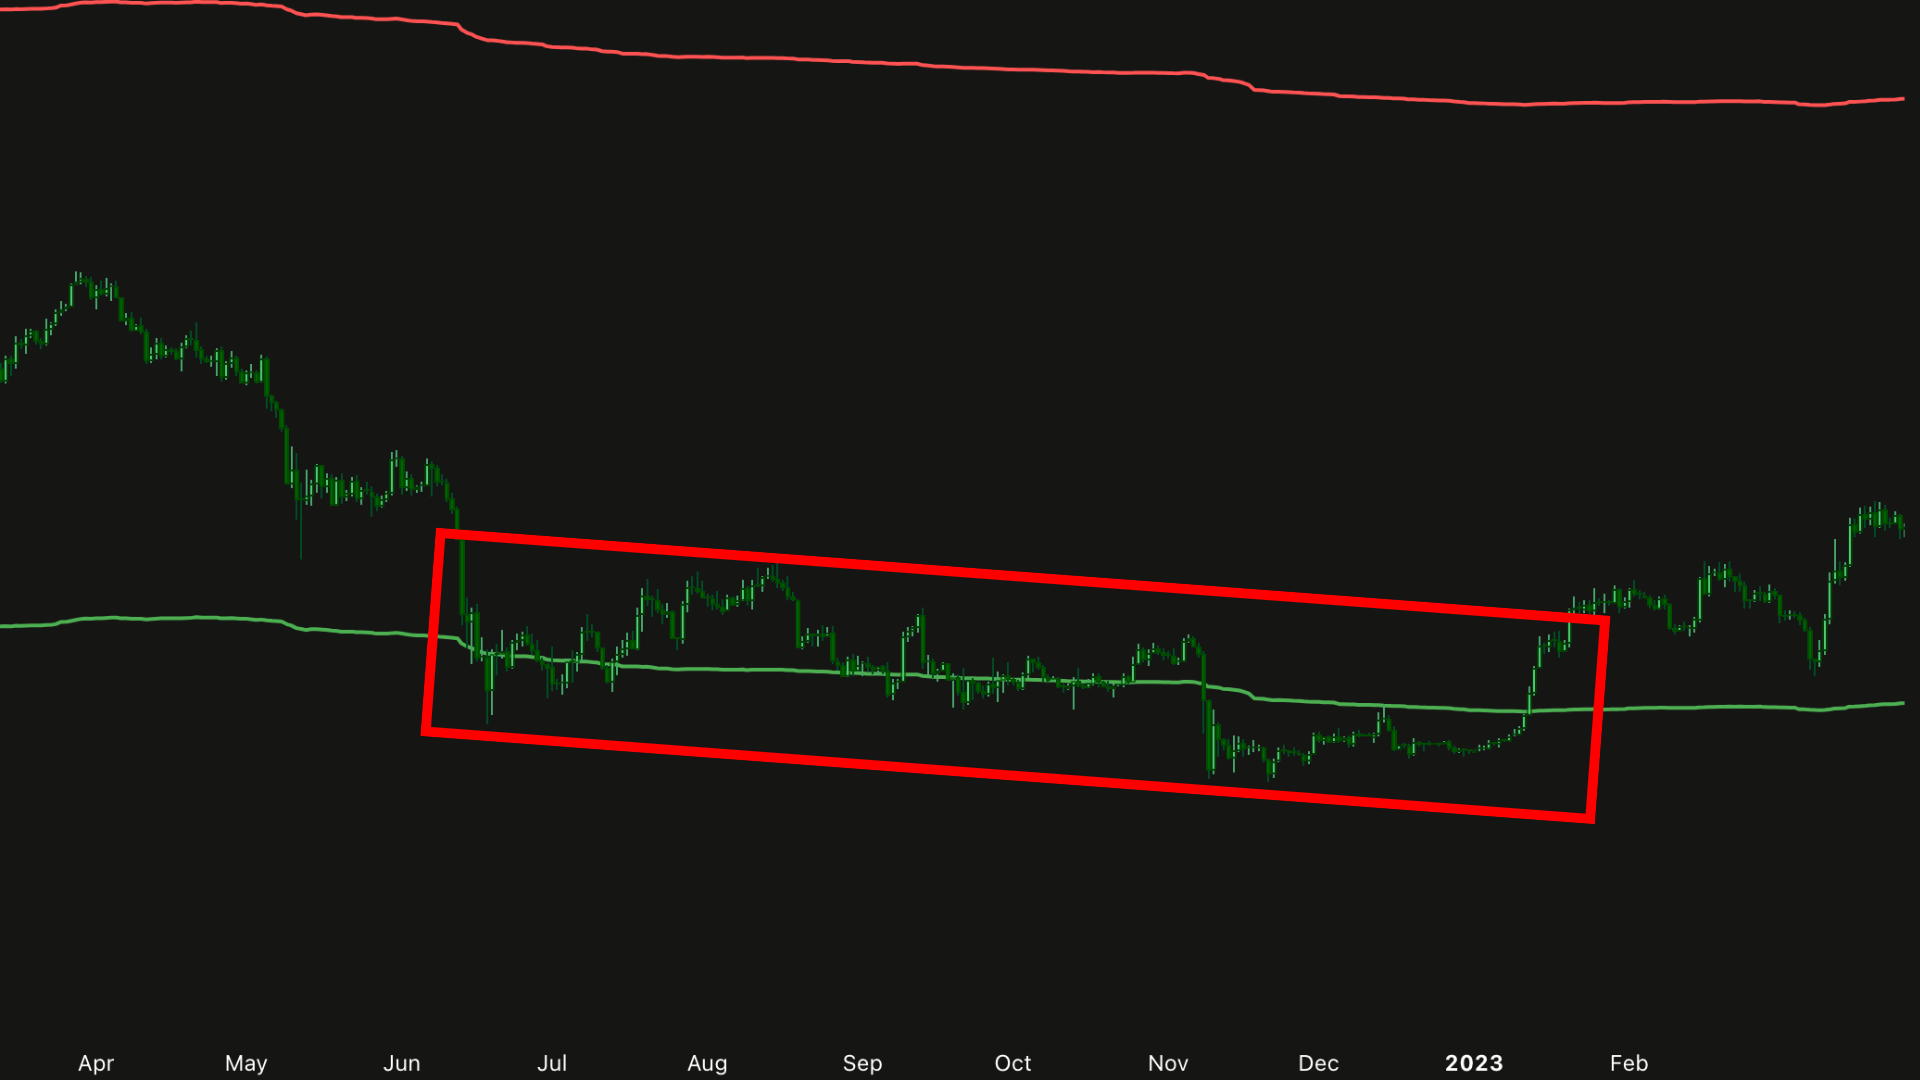
Zoom out on Bitcoin’s price chart, and you’ll see it dance between the CVDD and the Terminal Price. However, Bitcoin doesn’t just tap these lines once and reverse. It often revisits them multiple times over weeks or months. For example, in 2022, it dipped below the CVDD repeatedly as the bear market dragged on. This back-and-forth reflects Bitcoin’s volatility—and why timing the market perfectly is a fool’s errand.
How to Use These Metrics
Understanding these indicators is just the first step—applying them effectively is what separates great Bitcoin investors from the rest.
Don’t Try to Time the Market Perfectly
If there’s one lesson here, it’s: don’t try to catch the exact bottom or top. Bitcoin’s price can linger near these lines or even overshoot them. Lump-sum investing the moment it touches the CVDD or Terminal Price might leave you exposed to short-term swings.
Use a Dynamic Investment Strategy
Rather than making one big trade, a smarter approach is dollar-cost averaging (DCA):
When Bitcoin touches the CVDD line, consider accumulating gradually over weeks or months.
As Bitcoin nears the Terminal Price, consider reducing exposure or taking partial profits to manage risk.
Set a Plan: Decide how much you’ll invest or take profits at these levels (e.g. $100 weekly).
Combine These Metrics with Other Indicators
While CVDD and Terminal Price are powerful tools, they’re not the only tools in the shed. They work best when used alongside other confirmatory indicators, such as:
Classic on-chain analysis tools (e.g. MVRV, SOPR, NUPL)
Market sentiment indicators (e.g. Fear & Greed Index, Hash Rate capitulation)
Macroeconomic sentiment (e.g. interest rates, regulatory news, etc.)
Key Takeaways:
CVDD Signals Value: The green line flags undervalued zones, ideal for patient accumulation.
Terminal Price Warns of Peaks: The red line highlights speculative highs, a cue for caution or profit-taking.
Patience Beats Precision: Bitcoin revisits these levels over time—focus on zones, not exact moments.
DCA Is Your Ally: Spread investments to harness volatility, buying low and easing off at highs.
I’ll see you in the next one.
Cheers,
On-Chain Mind
🎥 Watch the video of this article on YouTube!👇
Subscribe to the On-Chain Mind YouTube Channel!