

Bitcoin Short-Term Holders Are Capitulating

Hey everyone, and welcome back to the On-Chain Mind Newsletter.
Bitcoin has finally stirred. After months of market monotony, volatility has returned, price action is weak and short-term holders are finally capitulating again.
This has been one of the most reliable on-chain indicators for identifying undervalued zones where smart accumulation often begins.
In this article, we’ll dissect this recent spike in short-term holder capitulation and examine why the Capital Flows are still signalling structural bullish strength.
Let’s get into it.
Insights at a Glance:
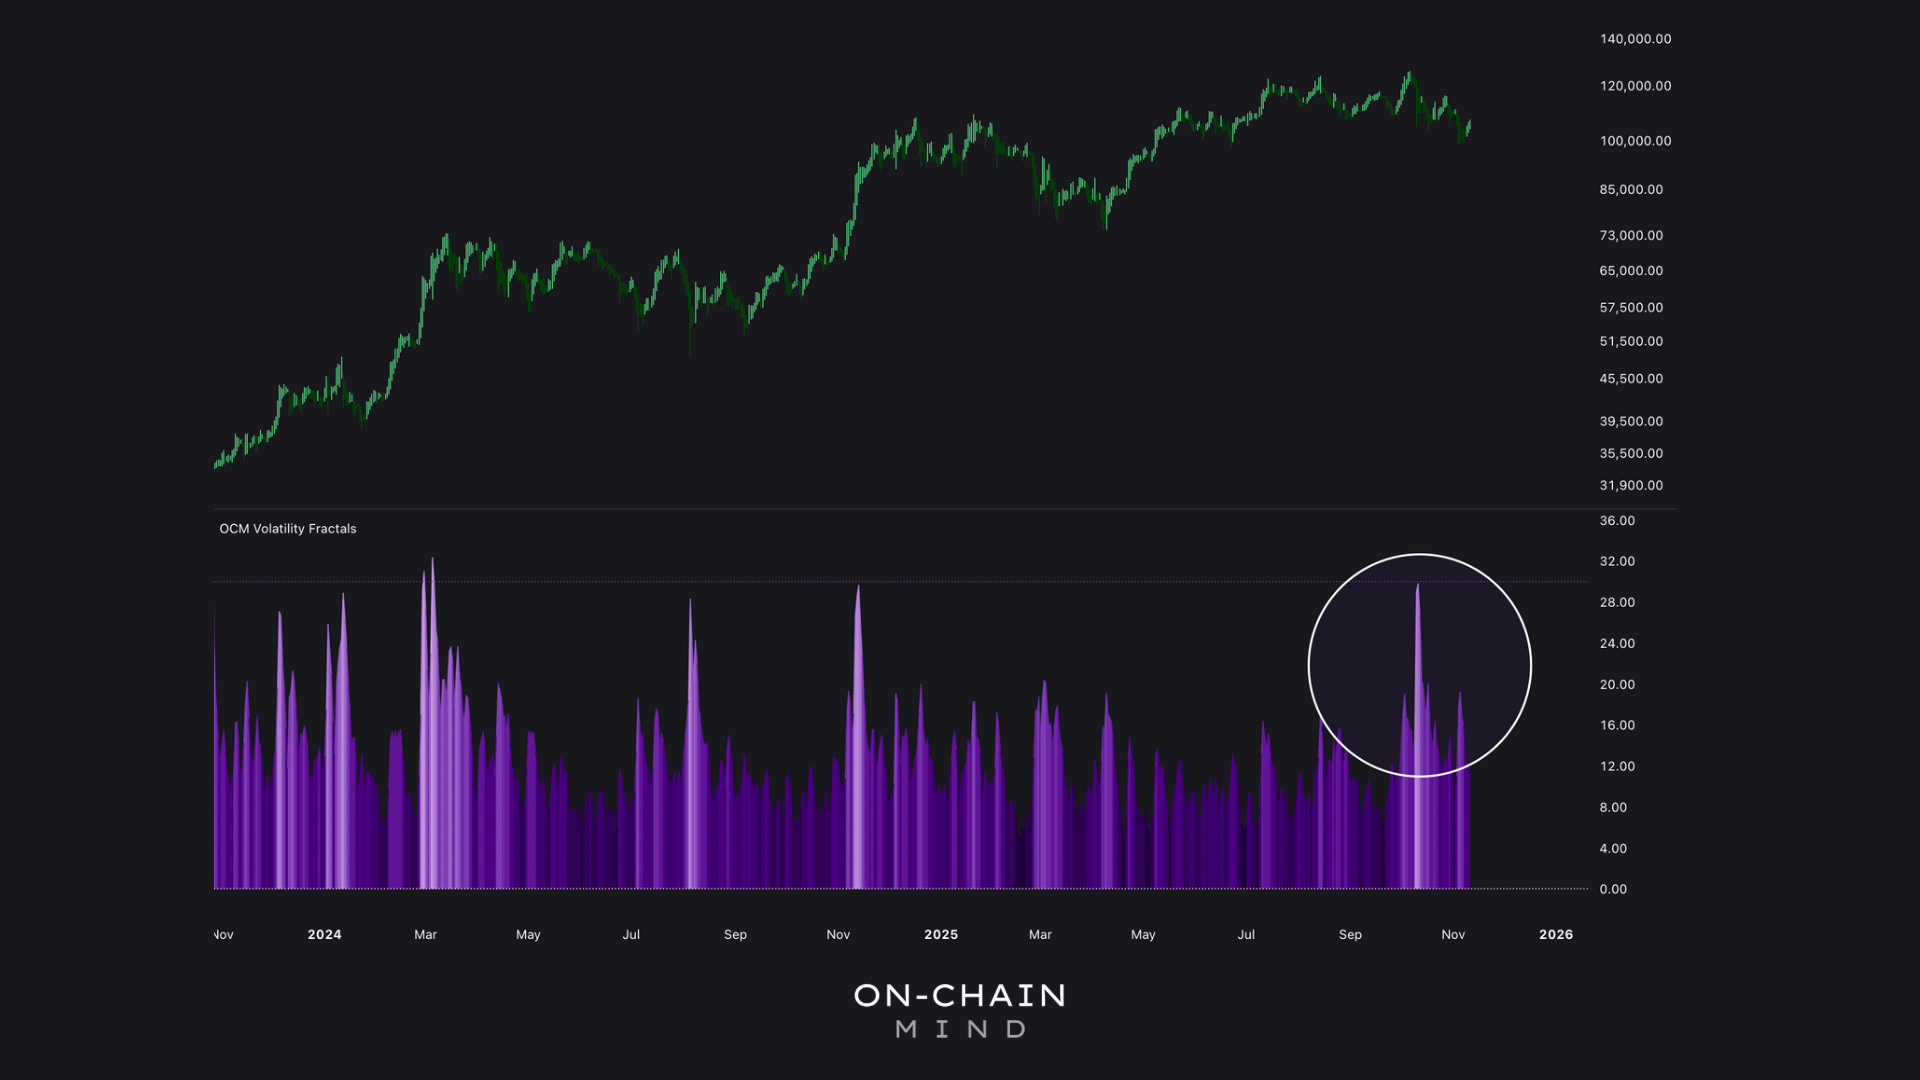
Volatility Awakens: After months of stagnation, volatility is returning, signalling early directional shifts in the market.
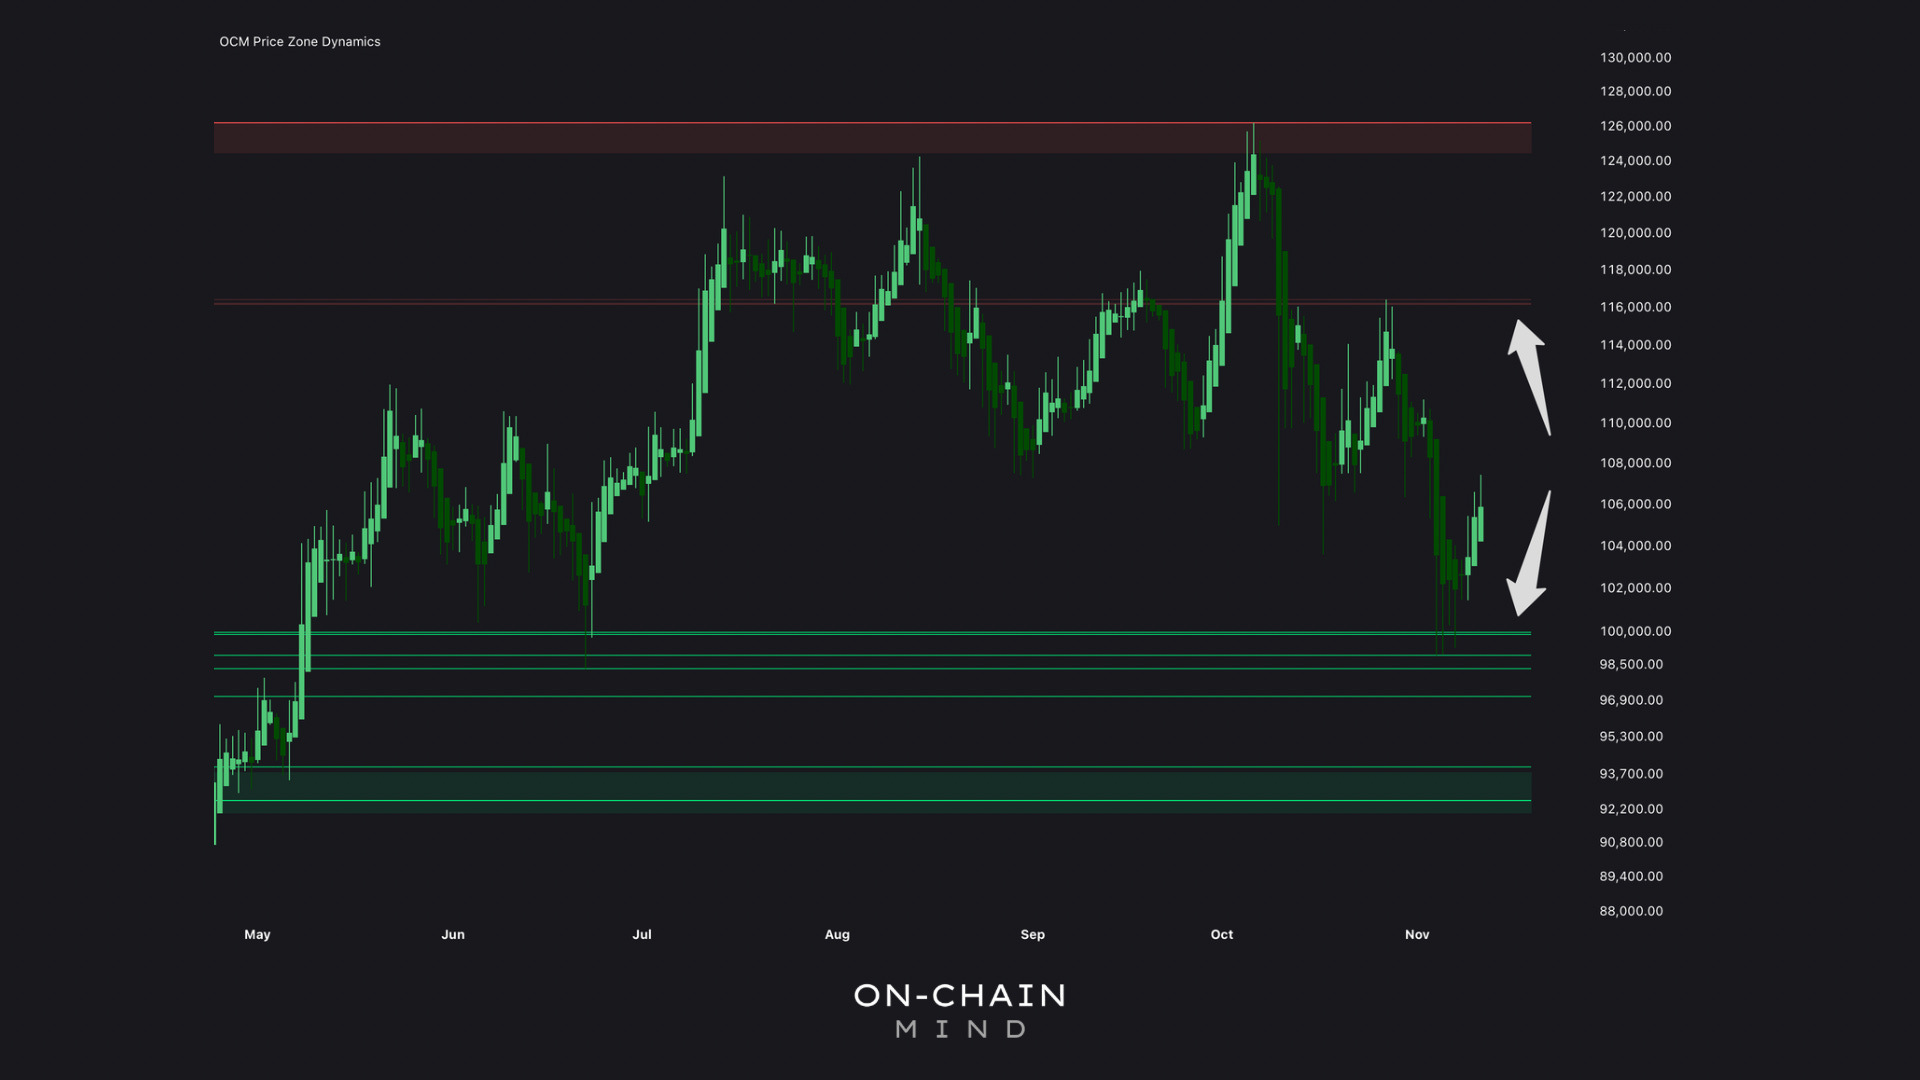
Support and Resistance Zones: Key levels around $100k and $115k define where buyers and sellers are currently active.
Capital Flow Momentum: Net inflows remain positive, suggesting the underlying bull market is still structurally intact.
Short-Term Holder Capitulation: A significant spike in Coindays in Loss hints at potentially golden buying opportunities, or early stress signals.
The Return of Volatility
Over the past few weeks, we’ve witnessed a notable resurgence in volatility. But this isn’t the euphoric, all-guns-blazing kind of volatility that comes at the top of a bull cycle. This is early-stage structural volatility, the kind that often precedes genuine directional shifts.
It’s a classic setup in crypto cycles: prolonged consolidation lulls participants into complacency, right before the market starts gearing up for meaningful movement. Psychologically, it’s when investors start checking their portfolios less frequently, or worse, liquidate out of sheer boredom.
But ignoring this low volatility is often a mistake; it’s precisely when the next directional move is being quietly primed.
The New Range
Bitcoin has been probing a critical support around the $100k level, and so far, it’s holding firm. Buyers have consistently stepped in at exactly the right level, absorbing selling pressure and preventing a cascade lower.
It’s a critical technical and psychological baseline, showing the market still respects this area, and it aligns with the 200-day moving average and a cluster of high-volume nodes from previous trading ranges where significant volume was transacted.
On the flip side, the first major resistance looms at $115k. To truly reignite this bull run meaningfully, Bitcoin needs to reclaim this level decisively — not just flirt with it or test it briefly, but close above it and hold it as support. Until that happens, the market remains in a delicate range-bound balance.
Price action this year has been far from clean. Right now, my long-term bias sits at about 70/30: 70% chance the broader bull market remains intact, 30% chance that short-term weakness takes over and dominates.
But the short-term market structure isn’t looking overly bullish. And this isn’t contradictory — it’s just the nature of Bitcoin cycles. The long-term structure can hold while the short-term remains messy, and positioning should reflect that duality.
For me personally, this means preparing for potential downside: $95k-$100k is my initial buying zone, with $90k-$95k being a level where I’d actively deploy a serious amount of capital if the market still confirms long-term strength. Upside is absolutely possible, but dry powder is my default stance at these levels until the signals flip clearly.
Capital Flow Momentum
One of my go-to tools for assessing Bitcoin’s medium-term health is the Capital Flow Momentum indicator. At its core, this metric captures whether new money is entering or capital is exiting the Bitcoin network by monitoring changes in the Realised Cap, which is the aggregate value of all Bitcoin based on the price at which each coin last moved on-chain — essentially, it’s the “cost basis” of the entire network.
Here’s how to interpret it:
Above zero (teal colours) = net positive inflows, suggesting supportive capital dynamics.
Below zero (red colours) = net outflows, indicating weakening demand or early bear signals.

Looking back at previous bear markets, this indicator nailed the transitions: prolonged red readings signalled capital bleeding out. Today, however, readings remain blue. There’s no euphoric strength showing in this metric, but importantly, there’s also no structural deterioration either. Capital isn’t fleeing the market; it’s just cautious.
A Capitulation Signal
Another overlooked gem is the Coindays in Loss metric for Short-Term Holders (STHs). A quick reminder: STHs are those who’ve held coins for less than 155 days and are the market’s most reactive participants.
Coindays measure the “age” of coins, giving weight to both the size of the position and how long it’s been held:
1 Bitcoin held for 100 days equals 100 coindays.
2 Bitcoin held for 50 days, also equals 100 coindays.
When STHs move coins at a loss, those coindays are “destroyed”, spiking the metric.
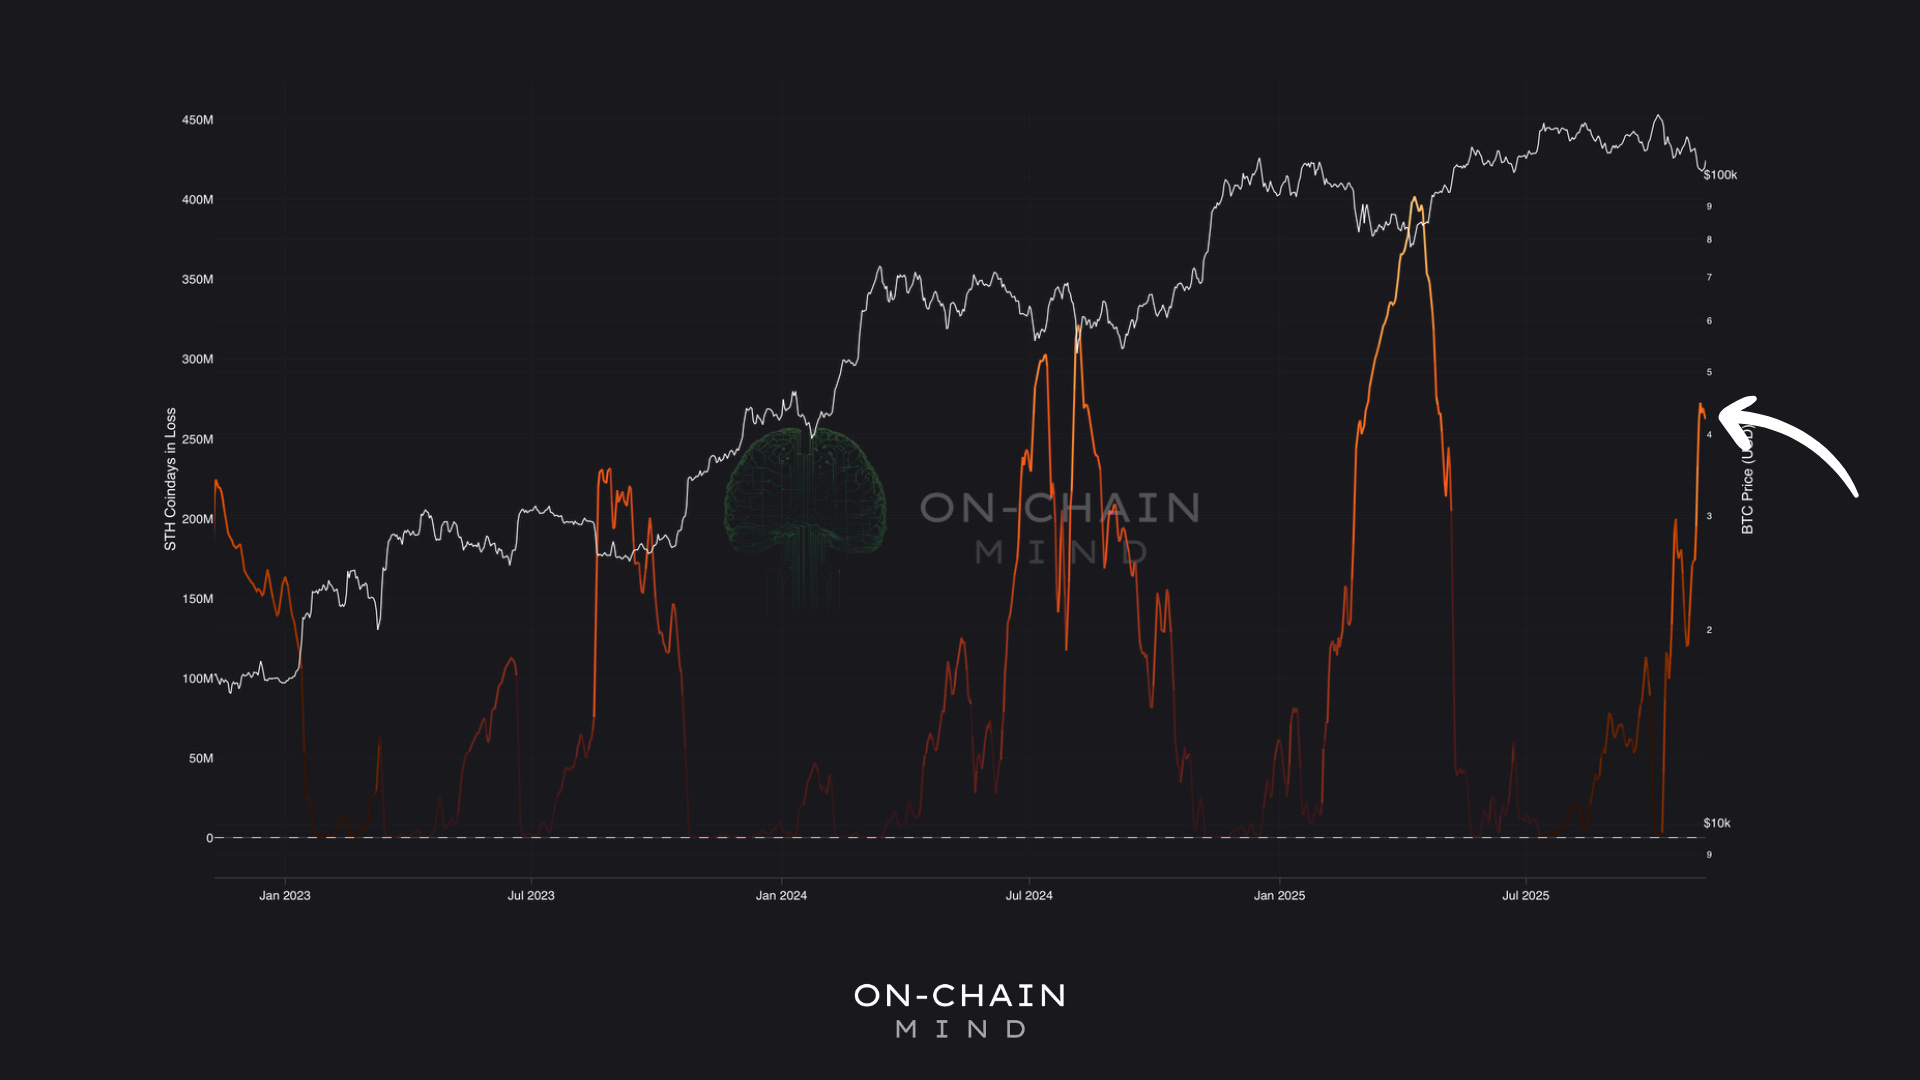
This spike reveals one of the clearest signals of capitulation, where emotional sellers give-in to fear and dump their coins at a loss. Essentially, it shows when short-term holders are giving up. And we’ve just seen the 3rd largest spike in 3 years, a level that historically clusters at turning points.
In bulls, it’s a bottom signal: exhausted sellers hand coins to strong hands, fuelling rebounds. In bears, it’s the start of grinding pain, with repeated spikes as hope fades.
Currently, it’s a single massive reading, not the cluster of a bear. This fits my view: short-term fragility, but long-term resilience.
How I’m Approaching This Market Structure
Look, I’ve been in this game long enough to know when the market is conflicted. Right now it’s loaded with energy, sitting right on a knife-edge between a short-term breakdown and a continuation of the broader uptrend. But here’s the nuance most people miss: rising volatility and short-term holder capitulation do not automatically signal the end of a bull market. They often appear inside bull markets, not just at the end of them.
That said, I’m not pretending everything is rosy. The short-term structure is fragile, and downside feels like the more probable path in the immediate term. My approach reflects that. I’m sitting on dry powder, ready to deploy if the weakness extends. And patience is more valuable than heroics here, and between $95k-$100k is where I’ll start buying more aggressively, assuming the signals confirm it. Just don’t delude yourself into betting the farm without conviction and data backing it.
Right now, Bitcoin is at a genuine inflection point. If you’re a long-term bull, there’s no need to panic, but if you operate on shorter timeframes, you need to be watching these signals like a hawk.
In my view, this STH capitulation spike is a gift. Weak hands are folding; strong hands are likely stepping up. And if Capital Flow Momentum holds its blue readings, we’re simply witnessing a reset, not the start of a collapse.
Ultimately, Bitcoin is teaching the same lesson it always does: cycles are rarely neat, and if you can’t stomach the chaos, you won’t enjoy the payoff.
If you want to unlock the full picture — including access to 100+ Custom Indicators — consider upgrading to Premium 🚀
I’ll catch you in the next one.
Cheers,
OCM
🎥 Watch the video of this article on YouTube!👇🏼
Found this valuable? Share it with a friend who follows the crypto market — they’ll thank you later!