


Bitcoin Topping? These Metrics Say No
What the on-chain data is telling us about this phase of price discovery

Hey everyone, and welcome back to the On-Chain Mind Newsletter.
Bitcoin has been surging past its all-time high, snapping out of a prolonged volatility coil that’s been brewing for weeks. But with price discovery in full swing, the pressing question is: how sustainable is this surge? I’ll show you what the smart money is doing and where the statistically overheated price levels lie. Whether we continue stair-stepping higher or shift into a full-blown parabolic phase will depend on what happens next, and the clues are already on-chain.
Let’s get into it.
Insights at a Glance:
Long-term holder conviction is surging, with over 15 million Bitcoin now held by this cohort, signalling a tightening supply and bullish market structure.
Short-term metrics like the Z-score Probability Waves suggest a potential short-term pullback as Bitcoin nears statistically significant highs around $118,000–$123,000.
The MVRV ratio highlights $140,000 as a key level where profit-taking could trigger a larger consolidation or a longer-term correction.
We’re in a transitional phase, not yet in the parabolic euphoria of a cycle top, but building a foundation for potentially higher prices.
An Uncoiled Spring
Bitcoin’s recent rally didn’t happen in a vacuum. For weeks, the market exhibited a tightening volatility pattern and I wrote about this in my article: The Calm Before The Storm. This compression foreshadowed a significant move, and while the direction was uncertain, several indicators pointed to a bullish breakout. The catalyst is driven by conviction among Bitcoin’s most resilient investors, coupled with a market structure primed for upward momentum.
The Bullish LTH Backbone
One of the most compelling signals driving this rally is the behaviour of long-term holders (LTHs), often dubbed the “smart money” here in the Bitcoin world. These investors, defined as wallets holding Bitcoin for extended periods (typically > 155 days), are less swayed by short-term price fluctuations and more focused on long-term fundamentals. Their actions provide a window into the market’s underlying strength.
The Long-Term Holder Net Position Change
The 30-day net position change for long-term holders has been a standout metric. Currently, over 15.4 million BTC are held by LTHs, a near-historic high. This surge in LTH accumulation signals:
Strong conviction: LTHs were not selling around the recent elevated price levels near all-time highs. Instead, they were accumulating, reflecting confidence at these levels.
Tightening supply: With fewer and fewer coins available on exchanges, the supply-demand dynamic tilts in favour of price appreciation.
Historical alignment: Green spikes in this metric have historically coincided with dip-buying opportunities, marking moments of accumulation during temporary price weakness.

This behaviour is profoundly bullish. When LTHs hold firm, it reduces the liquid supply available for trading, creating upward pressure on prices (if demand continues). Conversely, red signals often mark local tops, as LTHs sell into strength. The current green signal, even past all-time highs, suggests the rally has legs.
Short-Term Trading Signals
While LTHs provide a macro perspective, the short-term traders amongst you also deserve attention. The three metrics below can help you manage the market’s immediate risks and opportunities. Let’s break them down.
1. Short-Term Risk Score
This is a custom indicator blending 8 on-chain and structural metrics into a single, normalised score. Designed to assess market risk, it’s particularly useful when Bitcoin approaches local overheated conditions.
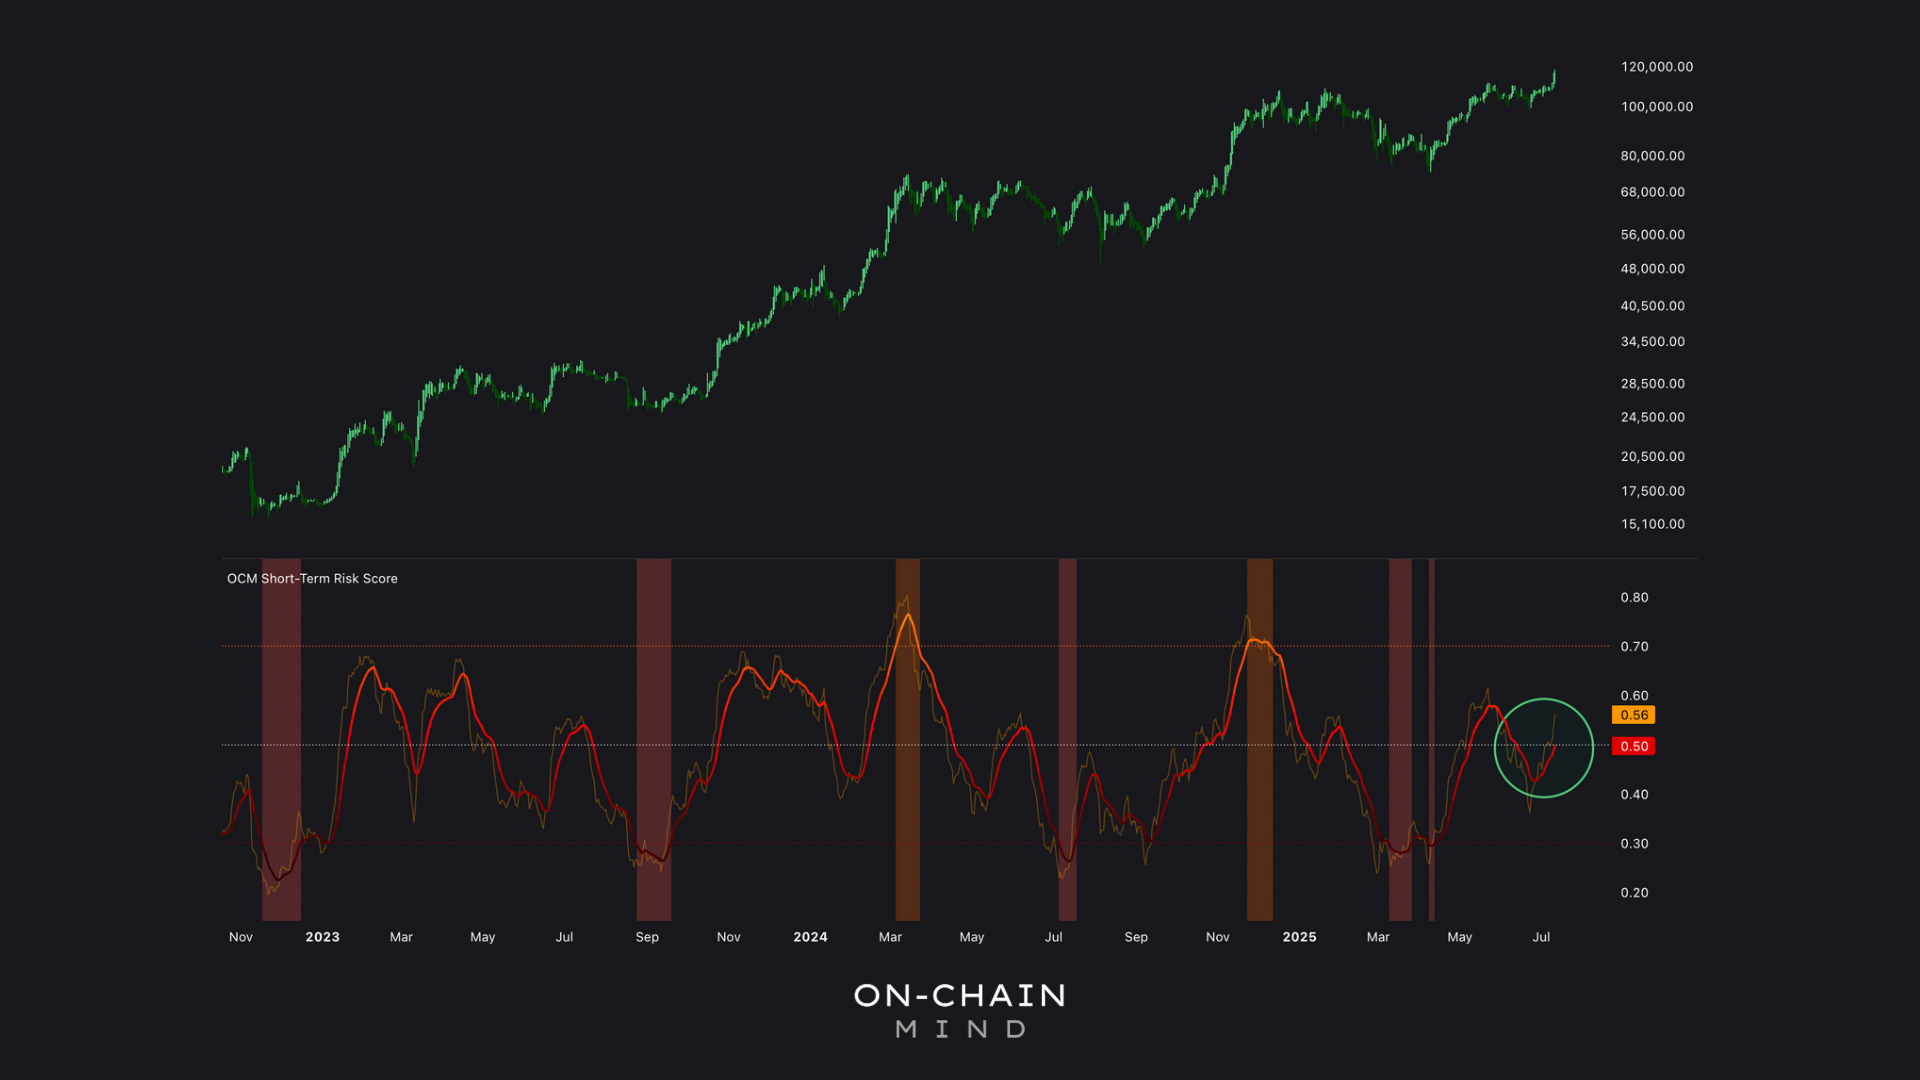
Currently, the score has crossed above its midpoint, signalling:
Caution for aggressive entries: The midpoint acts as a dollar-cost-averaging line in the sand, where I’d be more inclined to stop the DCA altogether or to scale in more cautiously rather than chasing the rally.
No immediate sell signal: The score hasn’t reached the overheated threshold (above 70), as seen most recently in March and November 2024, suggesting the trend might continue for now.
For now, it advises patience. I’m letting the trend unfold while preparing for potential dips back to accumulation zones.
2. Z-Score Probability Waves
The Probability Waves track Bitcoin’s price relative to its statistical norms, using standard deviation bands to identify overbought or oversold conditions. The recent rally has pushed Bitcoin to the +2 standard deviation band (around $118,000), with the +3 band (near $123,000) in sight.
Increased pullback risk: Historically, the +2 band signals a higher probability of a short-term correction or consolidation. The +3 band almost always triggers a pause.
Base case scenarios: Bitcoin may revert to the $110,000–$114,000 range or push to the low $120,000s before retesting the previous all-time high as support. If it can achieve this, that would be very bullish.

3. MVRV Ratio σ Bands
The Market Value to Realised Value (MVRV) ratio compares Bitcoin’s market cap to the value of coins at their last transaction price, offering insight into unrealised profits. By overlaying σ bands, we can pinpoint levels where the market may overheat. Currently:
The $140,000 zone is critical: This level marks where average investor profits become overstretched, historically triggering consolidation or pullbacks.
Room for upside: Bitcoin isn’t yet in the overheated zone, suggesting potential for further upside before profit-taking intensifies.

Breaking The Step-Ladder
Bitcoin’s current bull market follows a “step-ladder” structure: sharp upward moves followed by grinding consolidation phases. This pattern is healthy, as it:
Resets momentum: Consolidation flushes out over-leveraged positions, preventing unsustainable bubbles.
Builds support: Each consolidation creates a foundation for the next leg up.
Contrasts with parabolic phases: Unlike the face-melting rallies of cycle peaks, this structure reflects measured growth.
This rhythm suggests Bitcoin is still in a transitional phase, building the foundation for a potential parabolic run. However, retail hasn’t arrived back in full force yet, and we nearly always need that to trigger the classic blow-off top patterns we’ve become accustomed to at the previous cycle peaks.
The “parabolic phase”, where prices accelerate vertically, is the hallmark of Bitcoin’s cycle tops. When I look at all of the on-chain data and macro signals, it suggests we’re still in a late-stage accumulation phase, rather than the final stages of the show. Until the step-ladder structure breaks and we transition into classic parabolic mania, I’m going to keep expecting more of the same. And the 4 metrics we’ve covered today are my go-to’s for squeezing out maximum returns on this run up to the top.
Key Takeaways
Long-term holders are the market’s backbone, with their accumulation at historic highs signalling robust bullish conviction.
Short-term indicators suggest caution, as Bitcoin nears over overbought levels, with $110,000–$114,000 as a potential retest zone.
The $140,000 level is a critical threshold, where profit-taking could trigger a major pause.
We’re not in the parabolic phase yet, but the foundation is forming for a potential explosive move, pending retail euphoria.
If you want to unlock the full picture — including access to my Custom Indicator Suite — consider upgrading to Premium 🚀
I’ll see you in the next one.
Cheers,
On-Chain Mind
🎥 Watch the video of this article on YouTube!👇🏼
Subscribe to the On-Chain Mind YouTube Channel!
I use a steuctural system called bitform. I also see this bullrun goin forward. Top coulf be around q4 2026/q1 2027. If you are intrredted in my way of structural forecast: https://bitform.substack.com/
Awesome work. Thank you