

How High Can Bitcoin Go This Cycle?
A Look into Time-Based and On-Chain Modelling

Hey everyone, and welcome back to the On-Chain Mind Newsletter.
Can we mathematically predict where Bitcoin tops out this cycle? That’s the question we’re tackling today by combining several high-conviction indicators into one cohesive narrative. From halving-based timing models to dynamic logarithmic price projections, we’ll explore just how far Bitcoin might go, and when it might get there.
But let’s be clear from the outset: this is not about trying to time the market perfectly. Instead, it’s about building a multi-layered framework that can help long-term holders and short-term traders alike make better decisions by understanding where we might be in the cycle.
Let’s get into it.
Insights at a Glance:
Timing the Cycle Peak: Historical halving cycles and monthly seasonality suggest a potential peak between October - November 2025.
Price Projections: Logarithmic growth bands and on-chain metrics point to a speculative price range of $240,000–$260,000 if a parabolic rally begins now.
Diminishing Returns: Bitcoin’s maturing market means each cycle’s gains are likely to be less explosive than the last, influencing price predictions.
Strategic Decision-Making: Combining multiple indicators and managing emotions are key to making smarter investment decisions.
Timing the Cycle
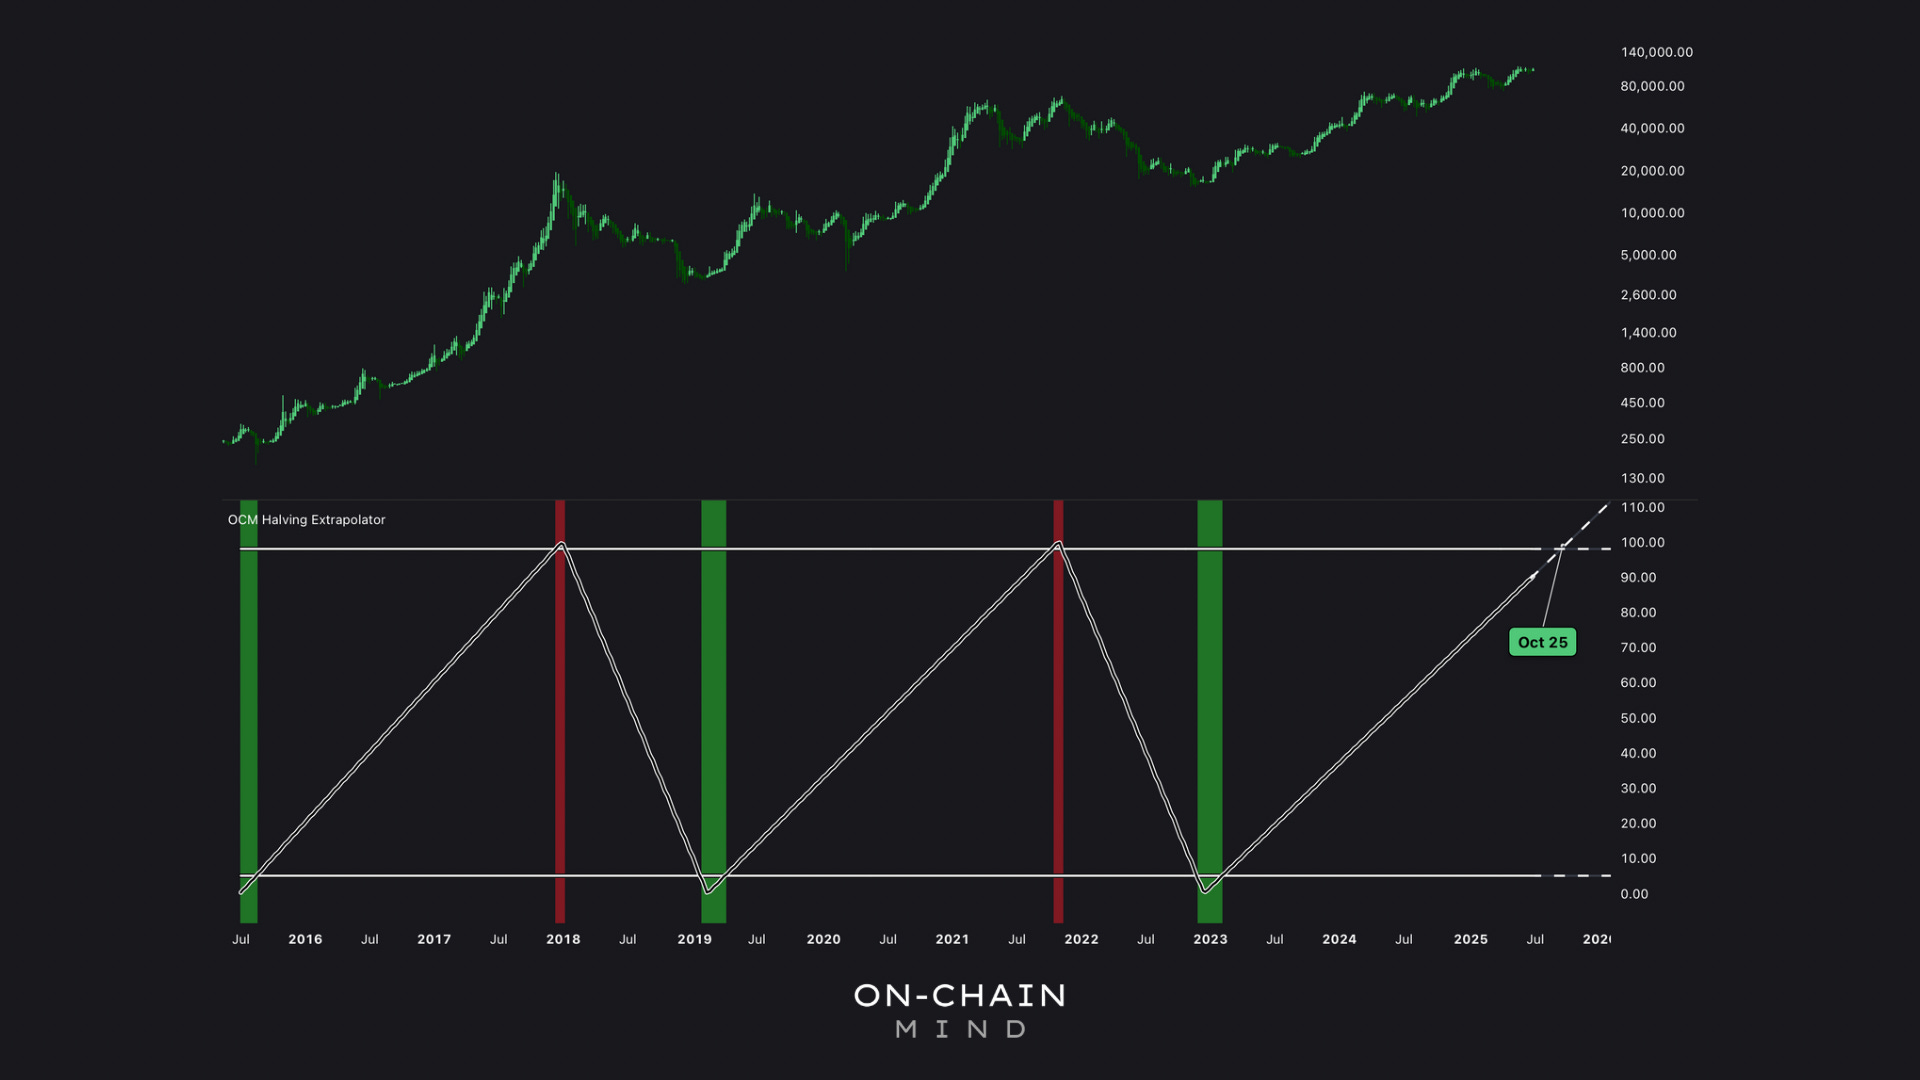
The Halving Extrapolator
The Halving Extrapolator is a basic time-based indicator that measures progress within Bitcoin’s 4-year halving cycle. Each cycle begins with a halving event, and the peak typically occurs 12–18 months later. The extrapolator calculates the fraction of time elapsed since the last halving (April 2024, in this case) and expresses it as a percentage of the cycle’s expected duration.
For example, if a halving cycle lasts approximately 1,460 days (four years), and 500 days have passed, we’re roughly 34% through the cycle. By mapping this percentage to historical cycles, we can estimate when the peak might occur. Based on this model, the current cycle is projected to peak around October 2025, approximately 17 months post-halving. This aligns with historical patterns, where peaks in 2013, 2017, and 2021 occurred around similar points in their respective cycles.
The Monthly Extrapolator
The monthly extrapolator complements the halving model by focusing on calendar-based seasonality. Bitcoin’s price often exhibits seasonal patterns, with certain months—like November and December—historically showing strong bullish momentum due to year-end market dynamics. This indicator calculates the current position within a longer-term seasonal framework and extrapolates forward to identify potential peak months.
According to this model, the cycle peak is likely to occur around November 2025, slightly later than the halving extrapolator’s estimate. The slight discrepancy reflects the unique nature of each cycle, as external factors like institutional adoption or the macroeconomic backdrop can stretch or compress timelines. For instance, some analysts argue that the current cycle may be extended due to the absence of the sharp parabolic price action yet to be seen like in previous bull runs. However, as we’ll see, price-based models can help refine these projections.

Pricing the Peak
Logarithmic Growth Bands
Bitcoin’s price growth isn’t linear; it follows a logarithmic trajectory, where explosive early gains give way to slower, more stable growth as the asset matures. The Logarithmic Growth Bands metric captures this by plotting three dynamic curves on a price chart:
Central Growth Trend: Represents Bitcoin’s “fair value” based on its historical growth rate.
Upper Resistance Band: Marks the ceiling where prices have historically topped out during parabolic phases.
Lower Support Band: Indicates the floor where prices tend to find support during corrections.

These bands are derived using logarithmic regression, a mathematical technique that models Bitcoin’s price growth while accounting for diminishing returns. Unlike linear models, logarithmic regression assumes that growth slows over time as adoption scales and market dynamics mature. The bands are adjusted dynamically based on price action and incorporate delay factors to reflect how Bitcoin’s growth rate decelerates as it gains full mainstream acceptance.
As of today, Bitcoin’s price sits above the central growth trend line of $86,000. The upper resistance band, which has historically capped cycle peaks, is currently at $207,000. This level rises daily as Bitcoin’s adoption and market capitalisation grow, but it’s not a static target. To estimate the cycle peak, we need to project where this band might be in five months, assuming a parabolic rally begins now.
Projecting the Parabolic Phase
Historical data shows that Bitcoin’s parabolic rallies—where prices surge exponentially—typically last 4-6 months, culminating in a tap of the upper resistance band. For example:
In 2013, the parabolic phase lasted about 4 months, with prices rising from $250 to $1,150 (a 350% increase).
In 2017, the rally spanned 6 months, taking prices from $4,200 to $19,000 (350% growth).
In 2021, the parabolic phase was about 4 months, with only a 150% increase from $29,000 to $69,000.
Given Bitcoin’s maturing market, we expect diminishing returns in each cycle. If we assume a 5 month parabolic phase starting now, the upper resistance band could climb to approximately $260,000 by November 2025, factoring in a moderated growth slope. This projection assumes significant retail and institutional FOMO to drive prices to such heights, a phenomenon that we’ve seen in every past bull run.
On-Chain Insights: The Cycle Top Lines
While time-based and logarithmic models provide a macro view, on-chain metrics offer a granular look at Bitcoin’s market dynamics. The Cycle Top Lines metric combines 6 key on-chain indicators that have historically signalled cycle peaks with remarkable accuracy:
Factored Terminal Price
Coin Value Elevation (CVE)
Cumulative Value Coin Days Destroyed (CVDD) Top
5x Balanced Price
4x Realized Price
Delta Top

When these indicators converge tightly and Bitcoin’s price breaches multiple lines, it signals a cycle peak. The merged average of these indicators currently sits at $193,000 but trends upward during parabolic phases.
Historical Performance
In past cycles, the Cycle Top Line has been a reliable marker:
2013: Price surged 350% during the parabolic phase, hitting the Cycle Top Line at $1,150.
2017: A 350% increase aligned with the line at around $19,000.
2021: A 150% rise, reflecting diminishing returns, matched the line at $69,000.

Given Bitcoin’s maturation, we could reasonably expect a further reduction in parabolic gains. If the current cycle follows a similar pattern, the Cycle Top Line could reach $240,000 by late 2025. This aligns closely with the logarithmic growth bands’ projection, reinforcing the speculative target of $240,000–$260,000.
Implications to Consider
For Long-Term Holders
For Bitcoiners who never plan to sell, these models are still valuable. They highlight periods when adding to your stack is less statistically favourable. For example, buying when prices approach the upper resistance band or Cycle Top Line increases the risk of short-term drawdowns. Instead, HODLers can use these signals to accumulate during dips, i.e. when we’re closer to the lower logarthmic support band.
For Short-Term Traders
If you’re aiming to time the market to perfection, then you face a tougher challenge. Relying on a single indicator is a recipe for failure, as no model is infallible. Instead, seek confluence—moments when multiple indicators (e.g. logarithmic bands, Cycle Top Lines, and many other on-chain metrics) align to signal a peak. A smarter approach is reverse dollar-cost averaging, where you gradually scale out of positions as signals converge, rather than trying to sell at the absolute top.
Managing Emotions
Whether you’re a HODLer or a trader, emotions are the enemy of sound decision-making. The euphoria of a parabolic rally can tempt you to buy at unsustainable highs, while fear during corrections can lead to panic selling. By anchoring your strategy in data-driven models, you can stay disciplined and avoid those impulsive moves.
The Bigger Picture
While short-term predictions are exciting, Bitcoin’s true value lies in its long-term potential. Over a 10-year horizon, the logarithmic growth model suggests that prices in the $200,000 range are not only plausible but almost inevitable, assuming continued adoption and no catastrophic disruptions. For long-term holders, this underscores the futility of betting against Bitcoin in favour of fiat currencies, which have consistently underperformed over time.
However, even the best models are just tools, not oracles. They rely on historical patterns, which may not hold in a rapidly evolving market. As always, the key is to stay flexible, keep disciplined, and let the data guide your path.
Key Takeaways
Cycle Timing: Bitcoin’s next cycle peak is projected for October–November 2025, based on halving and seasonal extrapolators.
Price Potential: Logarithmic growth bands and on-chain metrics suggest a speculative peak of $240,000–$260,000, assuming a parabolic rally.
Confluence is Key: Combining multiple indicators reduces reliance on any single model, improving decision-making for traders and investors.
Emotional Discipline: Success in Bitcoin investing hinges on reacting calmly to data and avoiding emotional traps during volatile market phases.
If you want to unlock the full picture — including access to my Custom Indicator Suite — consider upgrading to Premium 🚀
I’ll see you in the next one.
Cheers,
On-Chain Mind
🎥 Watch the video of this article on YouTube!👇🏼
Subscribe to the On-Chain Mind YouTube Channel!