

How to DCA using The Bitcoin Ω Score™
2 Key Strategies to Effectively Navigate Bitcoin Cycles

Dollar-cost averaging (DCA) is one of the most effective strategies for long-term Bitcoin investors, but not all DCA strategies are created equal. The Bitcoin Ω Score™ provides a data-driven approach to enhance your DCA strategy by adjusting purchases based on Bitcoin's market risk conditions.
In this article, we’ll explore two DCA strategies:
Strategy 1: Smart DCA – Increase buying at lower risk levels and stop at higher risk levels.
Strategy 2: Adaptive DCA – Same as above, but also DCA-out (sell) at high risk levels.
Both strategies optimise your Bitcoin exposure by leveraging the Bitcoin Ω Score’s risk assessment model, which categorizes market conditions from low-risk (dark blue) to high-risk (dark red).
Let’s get into it.
Why Use the Bitcoin Ω Score™ for DCA?
Traditional DCA involves buying Bitcoin at fixed intervals, regardless of price. While this smooths out volatility, it doesn't consider market conditions. The Bitcoin Ω Score™ improves this by analyzing on-chain metrics, technical signals, mining data, and price statistics to determine the relative risk of the market at any given time.
With this knowledge, you can allocate more capital when Bitcoin is undervalued and reduce exposure when the market is overheated.
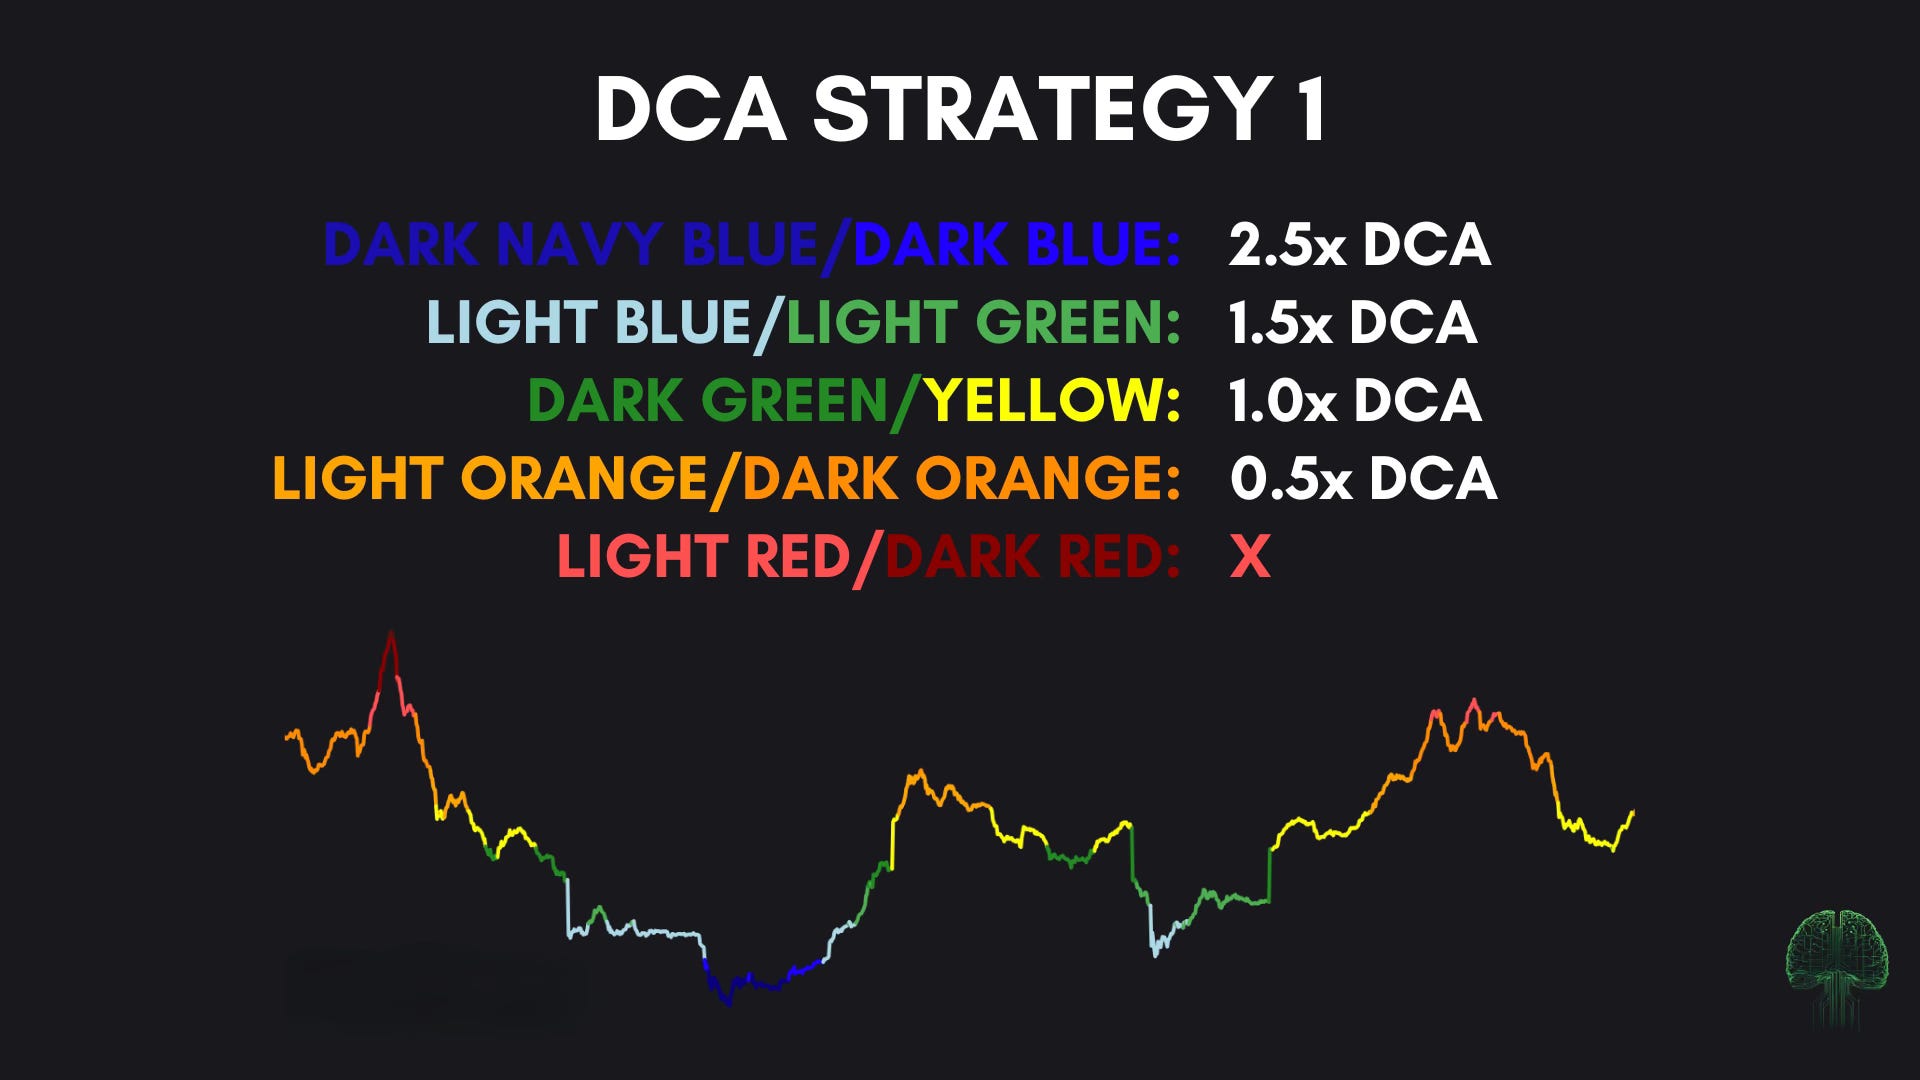
Strategy 1: Smart DCA – Buy More at Lower Risk Levels
This strategy follows the standard DCA approach but adjusts purchase amounts based on risk:
Increase DCA size when risk is low (dark navy blue to light green).
Reduce DCA size as risk rises (yellow to dark orange).
Stop buying entirely when risk is extreme (light red to dark red).
Example Allocation
Benefits
✅ Maximizes accumulation when Bitcoin is cheap.
✅ Reduces risk exposure when the market is overheated.
✅ Simple to implement for long-term investors.
Who Should Use This?
Long-term holders looking to build a strong Bitcoin position.
Investors who don’t want to sell, but want to optimise entry points.
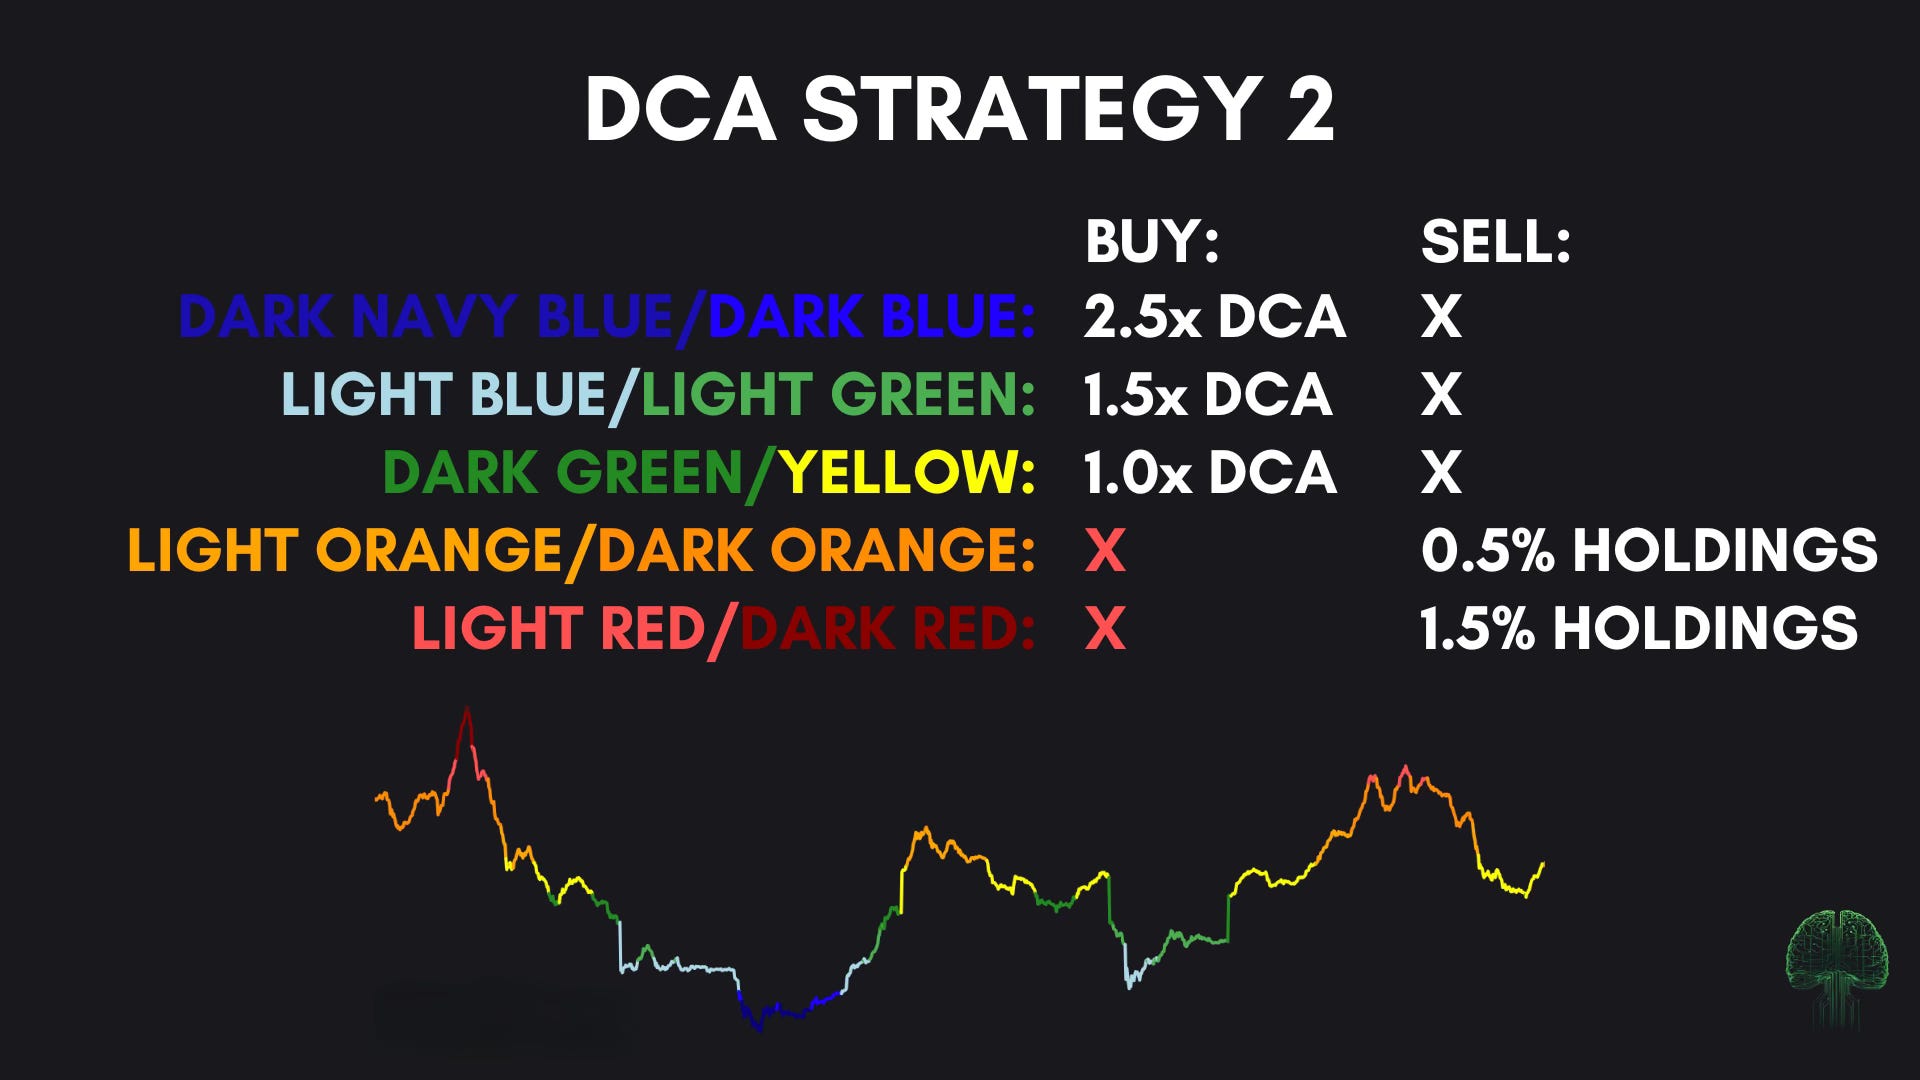
Strategy 2: Adaptive DCA – DCA-in at Low Risk, DCA-out at High Risk
This strategy builds on Strategy 1, but also incorporates DCA selling when Bitcoin enters high-risk territory.
Increase DCA buys at lower risk levels (dark navy blue to light green).
Reduce DCA size as risk rises (dark green to yellow).
Begin selling a small percentage at high-risk levels (light orange to dark red).
Example Allocation
Benefits
✅ Locks in profits when Bitcoin is overbought.
✅ Prepares capital for reinvestment at lower risk levels.
✅ Removes emotions from selling by automating profit-taking.
Who Should Use This?
Long-term holders who want to take some profits in high-risk zones.
Investors looking for an exit strategy while maintaining exposure.
$500 DCA Example
The Bitcoin Ω Score™ adjusts your Dollar-Cost Averaging (DCA) strategy, influencing both buying and selling behavior based on Bitcoin's risk levels. Here's how it works:
DCA Buy: Scaling Purchases Based on Risk
Your normal DCA amount is the fixed amount you invest periodically (e.g., weekly or monthly).
The multiplier (e.g., 1.5x, 2.5x) tells you how much to adjust your buy amount based on Bitcoin's risk level.
Example of Buy Adjustments (Assuming $500 DCA Amount)
Dark Blue zone (0-20% risk): Buy 2.5x your normal DCA → $1,250 per period
Light Blue zone (20-40% risk): Buy 1.5x your normal DCA → $750 per period
Dark Green/Yellow zone (40-60% risk): Buy 1.0x (normal DCA) → $500 per period
Light Orange/Dark Orange zone (60-80% risk): Pause buying → $0 per period
Light Red/Dark Red zone (80-100% risk): Stop buying completely → $0 per period
💡 Key takeaway: You buy aggressively when Bitcoin is cheap and reduce purchases as risk increases, avoiding overpaying.
DCA Sell: Taking Profits at High Risk Levels
When Bitcoin reaches overheated levels (Ω Score 60%+), you start systematically selling instead of buying.
The percentage shown (0.5% per day, 1.5% per day) tells you how much of your total Bitcoin holdings you sell daily while Bitcoin remains in that risk zone.
Example of Sell Adjustments (Assuming 1 BTC Portfolio)
Light Orange/Dark Orange zone (60-80% risk): Sell 0.5% of holdings per day → 0.005 BTC per day
Light Red/Dark Red zone (80-100% risk): Sell 1.5% of holdings per day → 0.015 BTC per day
If Bitcoin stays in the Dark Red zone for 10 days, you would have sold 15% of your holdings (0.15 BTC).
Once the risk level drops below 60%, stop selling and prepare to buy again.
💡 Key takeaway: You gradually sell into market euphoria, locking in profits without trying to time the exact top.
Final Thoughts
The Bitcoin Ω Score™ elevates DCA from a simple, passive strategy to a smart, risk-adjusted system. By scaling buys when Bitcoin is undervalued and systematically selling into market peaks, you maximize long-term accumulation while protecting gains. This approach removes emotion, optimizes returns, and ensures you're always on the right side of the market cycle. 🚀
If you found this valuable, consider sharing it with others or leaving a comment below with your thoughts.
Cheers,
On-Chain Mind
Subscribe to the On-Chain Mind YouTube Channel!
Hi, thank you for this chart.
I’d like to ask something. I am paying subscription and using TradingView.
In the chart, there are 20 different colors. Which one is Light Red? Is it number 17 or 18?
Second question – what is the value of this color on the axis? It should be around 0.8 (80%) am I right?
Thank you for your job!
Thank you for this insight. Love and appreciate from Indonesia