

Mastering SOPR | On-Chain Analysis 101
The On-Chain Tool Every Trader Should Know

Hey everyone and welcome back to the On-Chain Mind Newsletter.
Today, we’re breaking down one of the most powerful on-chain metrics: the Spent Output Profit Ratio (SOPR). This versatile indicator helps reveal when investors are selling—whether they’re locking in gains, panic-selling at a loss, or even exiting positions near breakeven. By analysing SOPR, we can gauge overall market sentiment and structure across different time frames, making it a valuable tool in both bull and bear markets. When paired with the MVRV, SOPR becomes even more insightful, providing a clearer picture of capital flows and investor behaviour. In this deep dive, we’ll explore how SOPR works and how traders can use it to navigate various market conditions.
Let’s get into it.
Insights at a Glance:
SOPR helps identify market trends, cycle tops and bottoms, and key support and resistance levels.
Short-term and long-term SOPR provide different insights, with short-term SOPR being especially useful for active traders.
SOPR works in tandem with MVRV, giving a full picture of realized vs. unrealized profits.
Traders can use SOPR to assess probabilities and refine their strategies in real-time market conditions.
What is SOPR and Why Does It Matter?
SOPR, or Spent Output Profit Ratio, is an on-chain metric that tracks whether investors are selling at a profit or a loss. It calculates the ratio of the price at which coins were last spent versus the price at which they were acquired.
At its core, SOPR helps us understand investor psychology:
When SOPR is above 1, it means that, on average, investors are selling at a profit.
When SOPR is below 1, it indicates that investors are selling at a loss.
When SOPR hovers around 1, the market is at a breakeven point, meaning the price at which coins were last acquired is similar to the price at which they’re now being spent.
Because it directly reflects realized profits and losses, SOPR is an incredibly fast-moving and actionable metric, particularly useful for active traders.
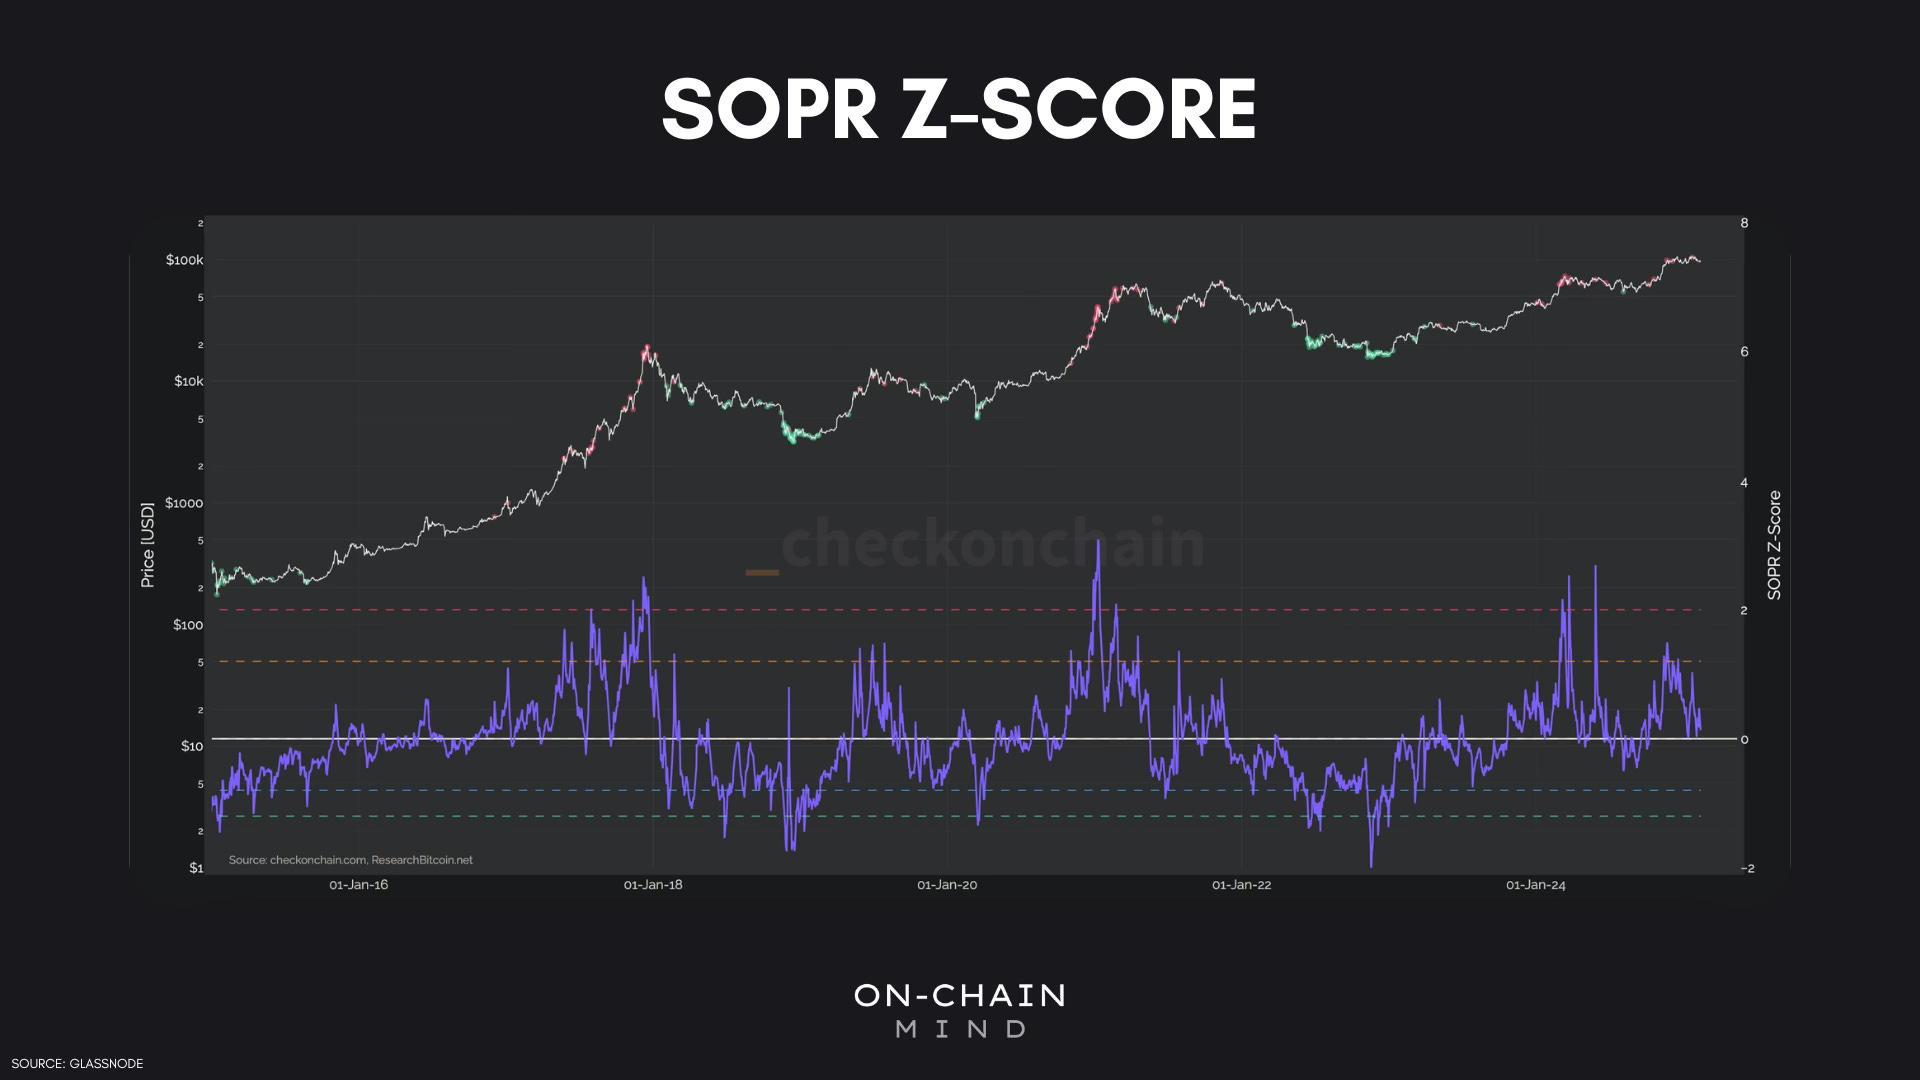
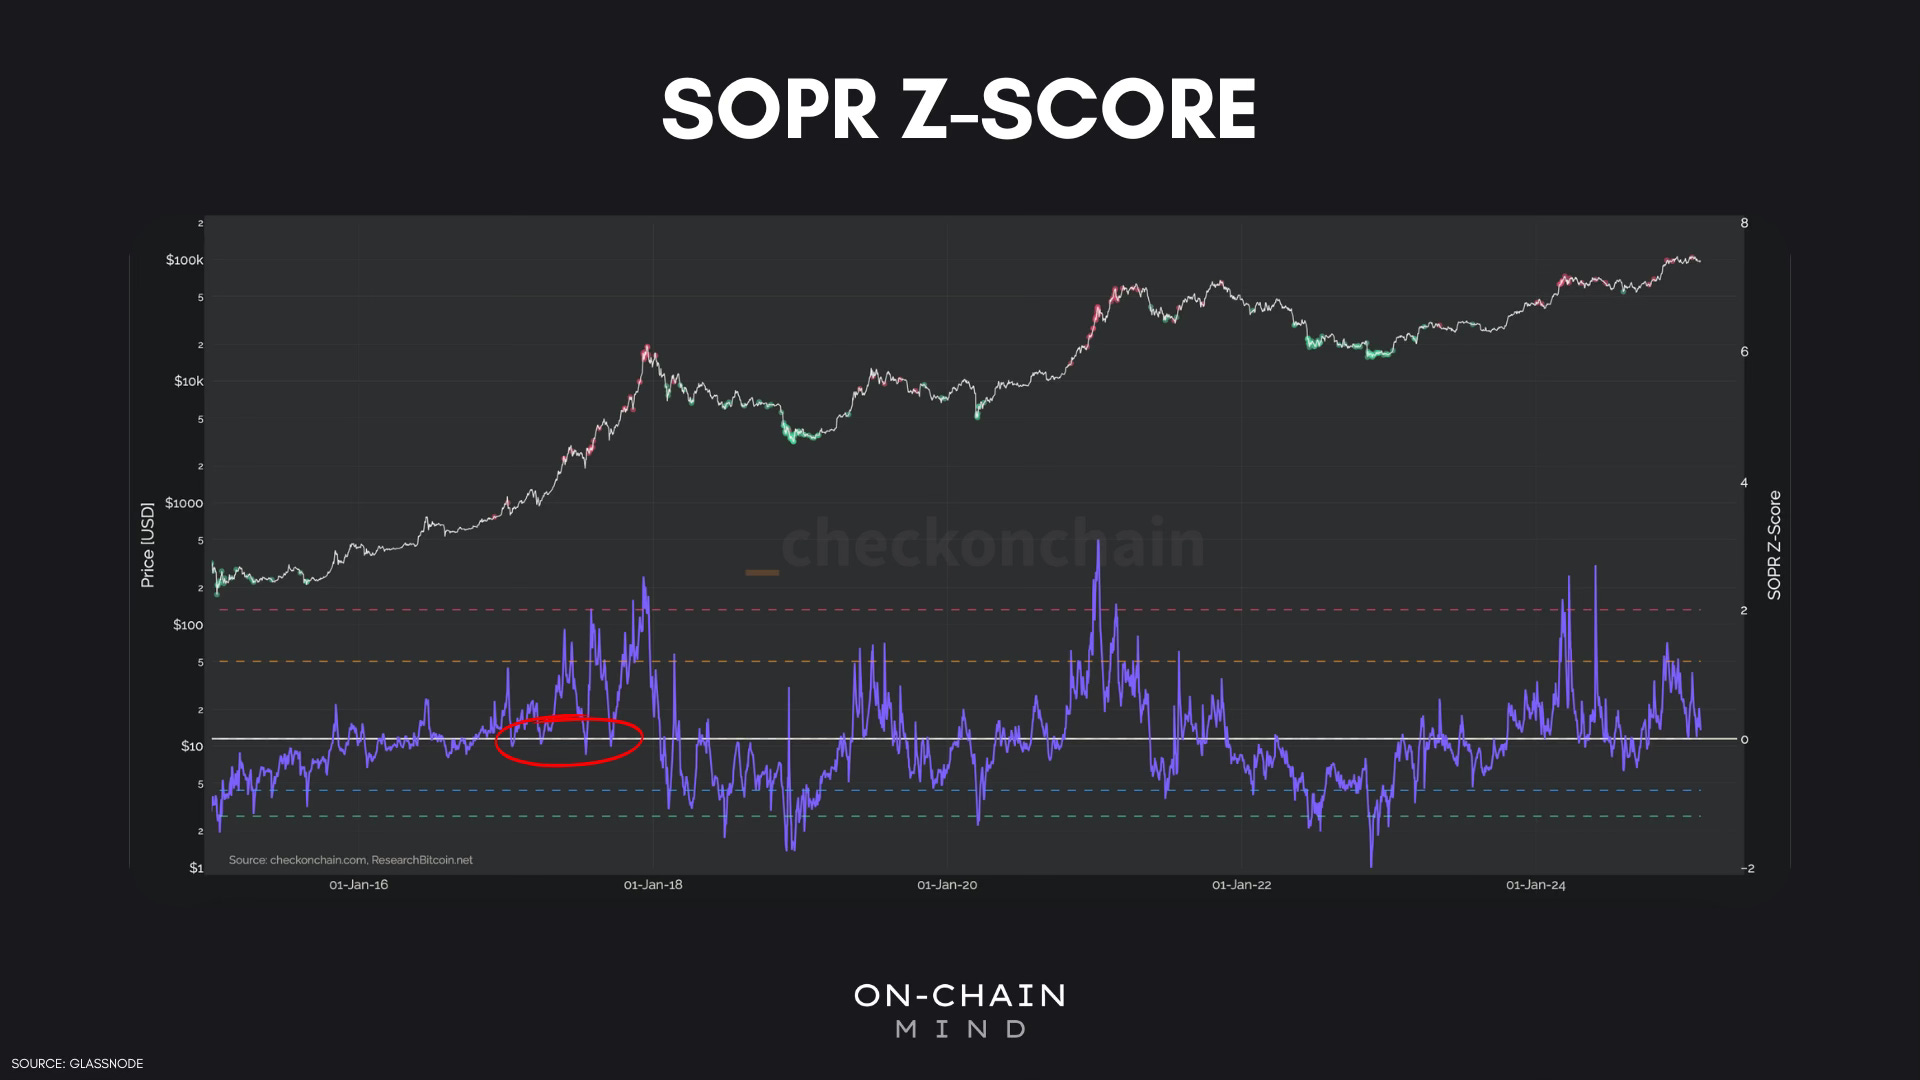
For the SOPR, we'll be using a z-score, which standardizes the data to make it easier to interpret. The z-score measures how far a value is from the mean, in terms of standard deviations, allowing us to quickly identify when the SOPR is unusually high or low relative to its historical range. This helps highlight significant shifts in market sentiment more clearly. Bear in mind, the profit/loss barrier on the z-score is 0.
The Spent vs. Unspent Domains
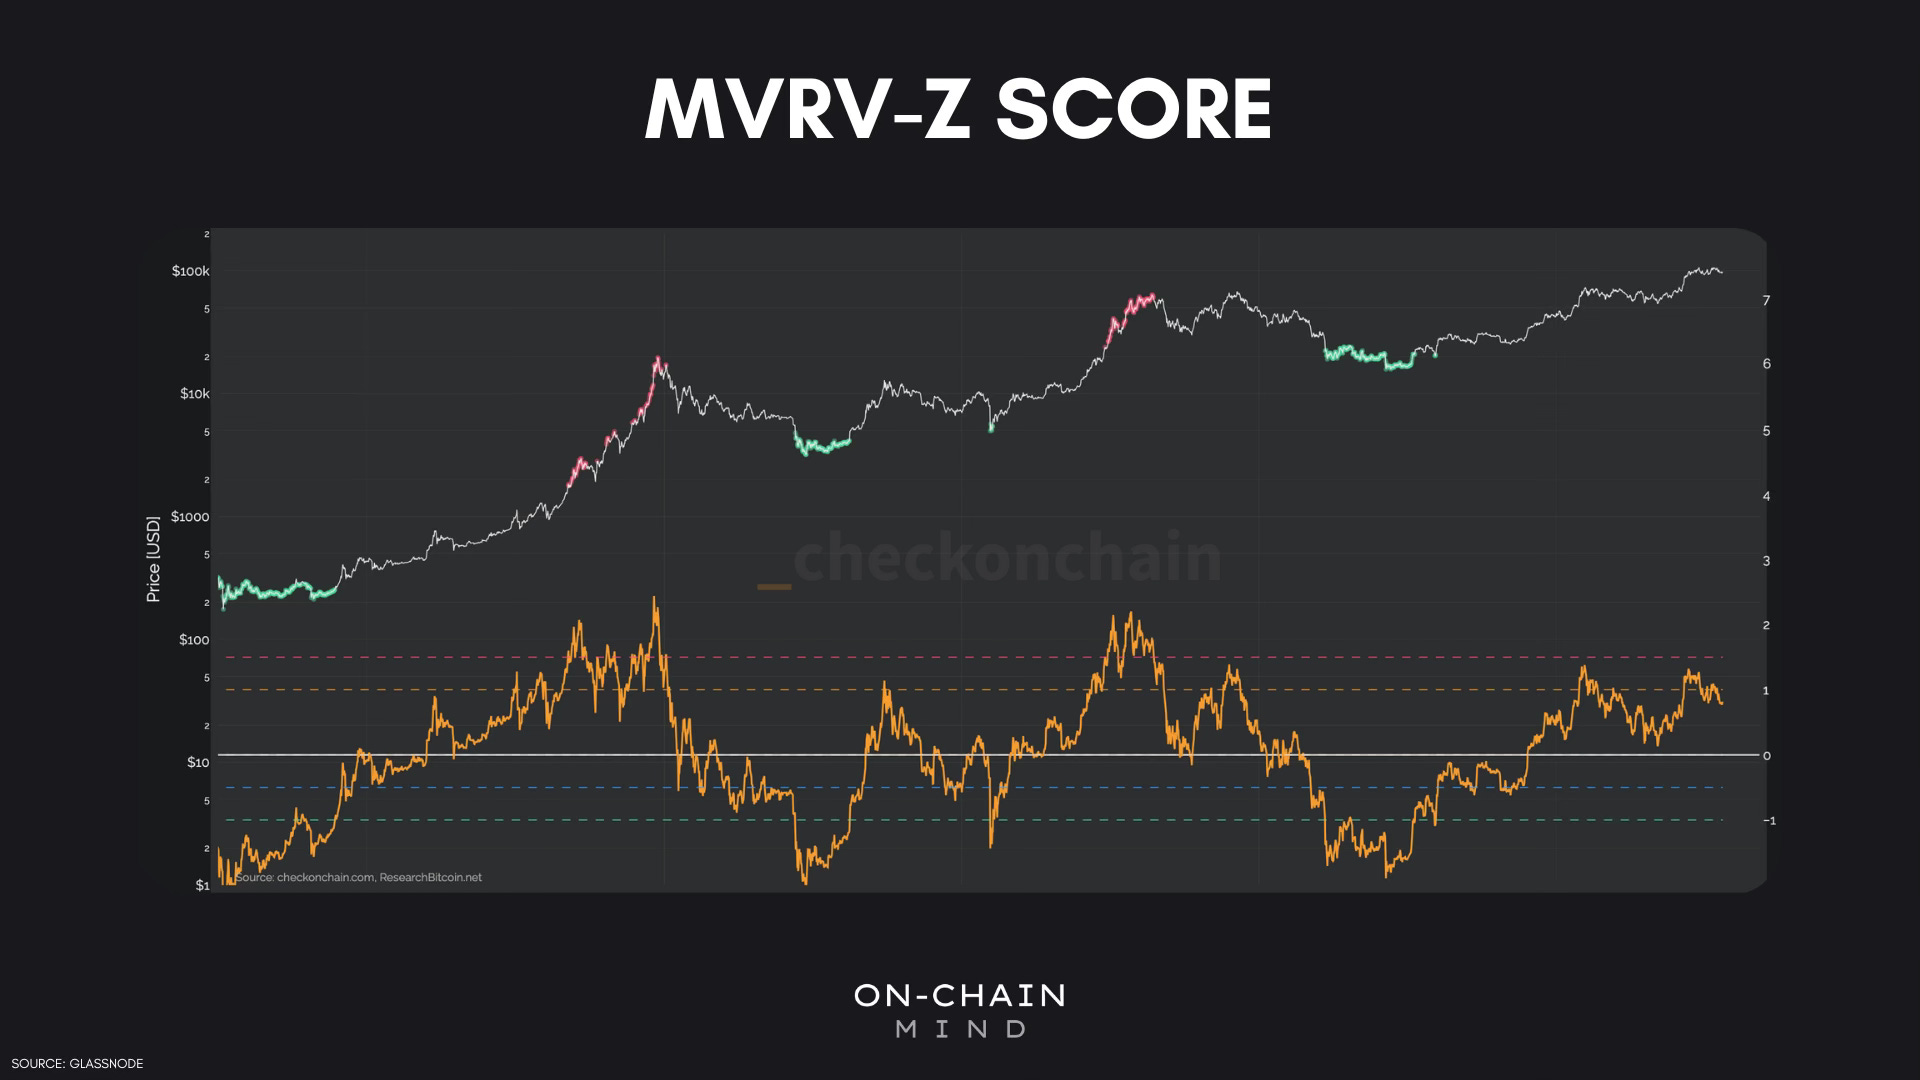
To fully grasp SOPR’s significance, we need to compare it with MVRV (Market Value to Realized Value):
MVRV describes the unspent domain, meaning it tracks the unrealized profits and losses of all coins still being held.
SOPR focuses on the spent domain, meaning it only considers coins that have actually moved.
Why This Matters:
MVRV is a leading indicator that suggests where selling pressure might emerge.
SOPR is a confirmatory indicator that shows what investors are actually doing.
For example, if MVRV is high, it means investors could be sitting on large unrealized profits. But if SOPR stays high, it confirms that investors are actually locking in those gains.
While MVRV gives us a hint about potential investor behavior, SOPR shows us the reality—whether investors are taking profits or capitulating. This makes SOPR a more responsive and fast-moving indicator, perfect for active traders looking for real-time insights.
Realized vs. Unrealized Profit and Loss
Realized profit and loss are key to understanding SOPR:
A realized profit occurs when an investor sells a coin at a price higher than their purchase price.
A realized loss occurs when they sell below their purchase price.
Why It’s Important:
During bull markets, SOPR tends to remain above 0 on the z-score, as investors take profits but the market absorbs the selling.
During bear markets, SOPR often remains below 0 on the z-score, as investors capitulate and sell at a loss.
In the 2022 bear market, we witnessed a surge in realized losses as investors, who had entered during the previous bull run, panic-sold their positions at rock-bottom prices. This capitulation created a sharp downturn. On the other hand, when investors take profits, new buyers step in at higher price levels, establishing a new cost basis. This transfer of assets between lower and higher cost bases is a key driver of market dynamics and future price movements.
STH vs. LTH SOPR
SOPR can be broken down into three main cohorts:
Total SOPR – includes all Bitcoin transactions.
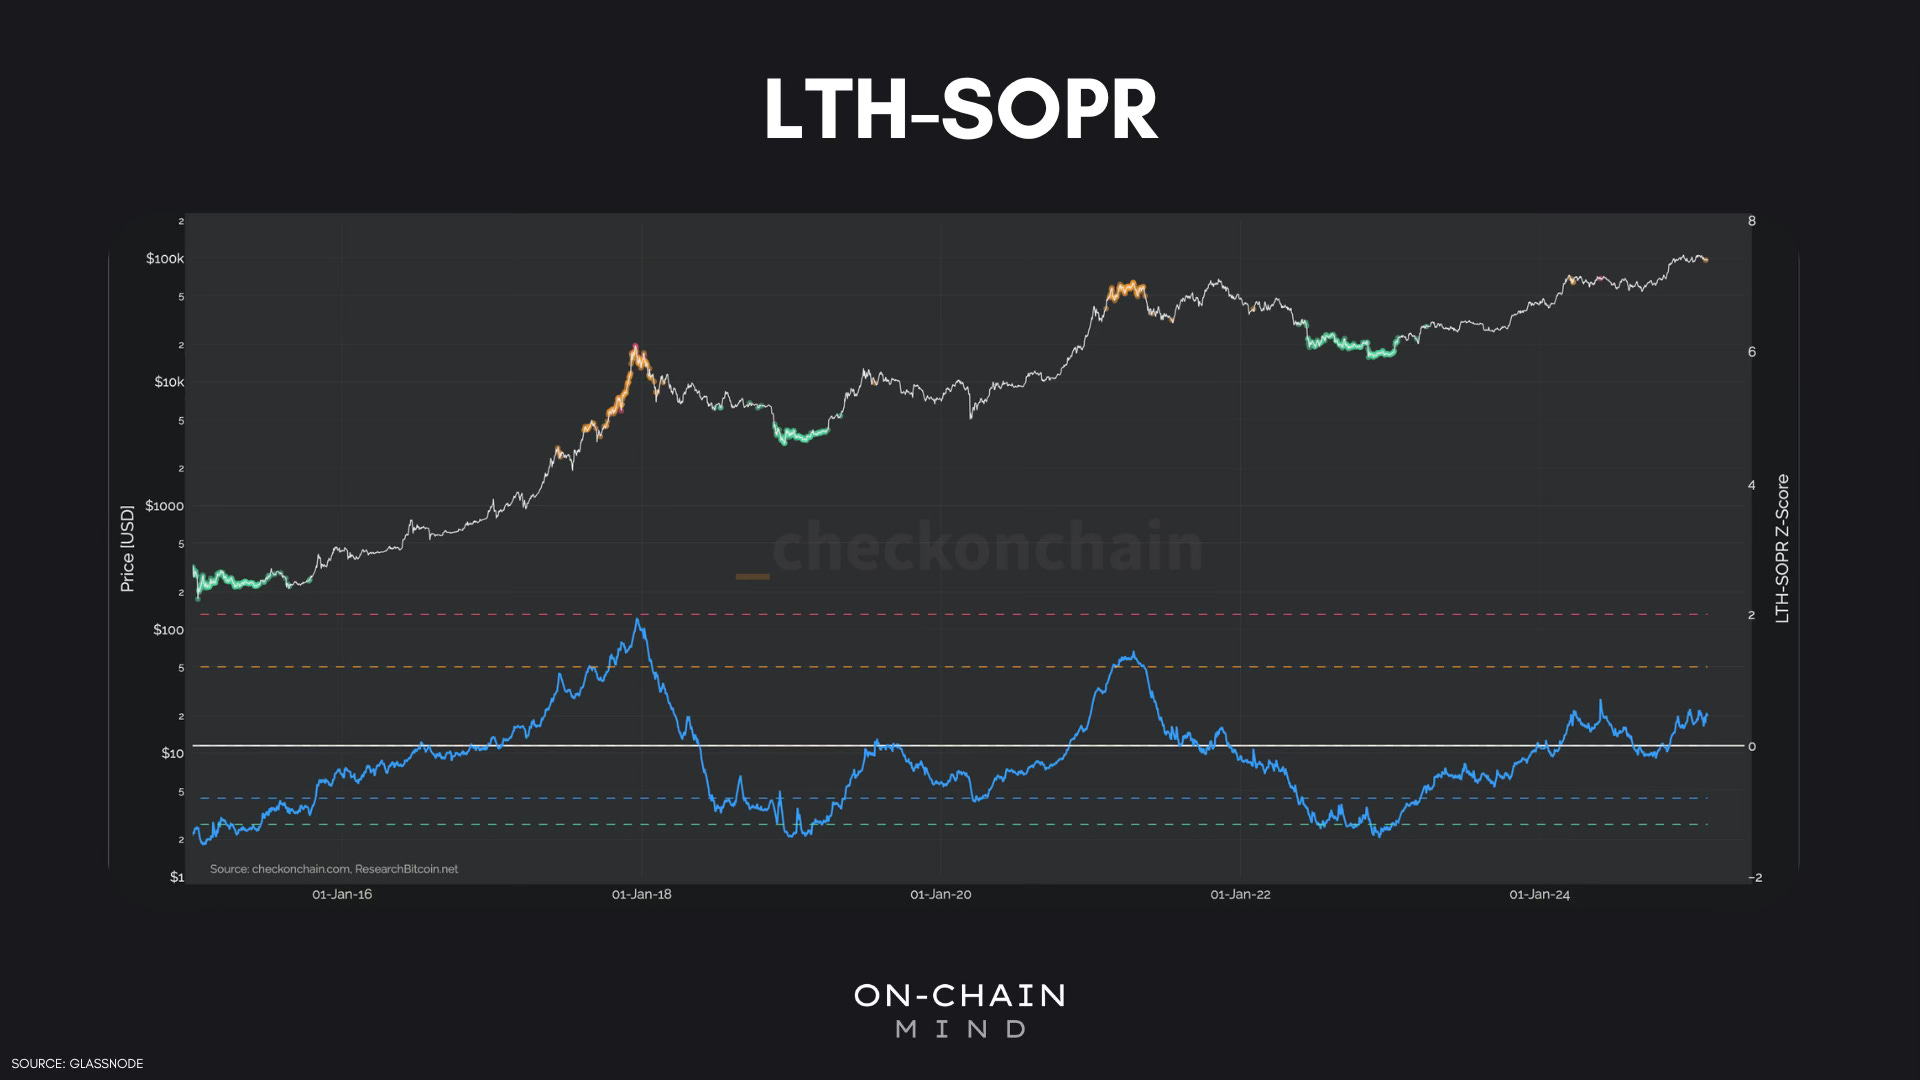
Long-Term Holder SOPR (LTH-SOPR) – focuses on investors who have held their coins for more than 155 days.
Short-Term Holder SOPR (STH-SOPR) – tracks investors who have held their coins for fewer than 155 days.
How They Work in Different Market Conditions:
LTH-SOPR is most valuable near market cycle extremes. Long-term holders usually accumulate coins during bear markets and sell during bull markets, so their activity is concentrated at market tops and bottoms. As a result, their SOPR values tend to have greater amplitude, reflecting the significant profits or losses they realize after holding coins for extended periods.
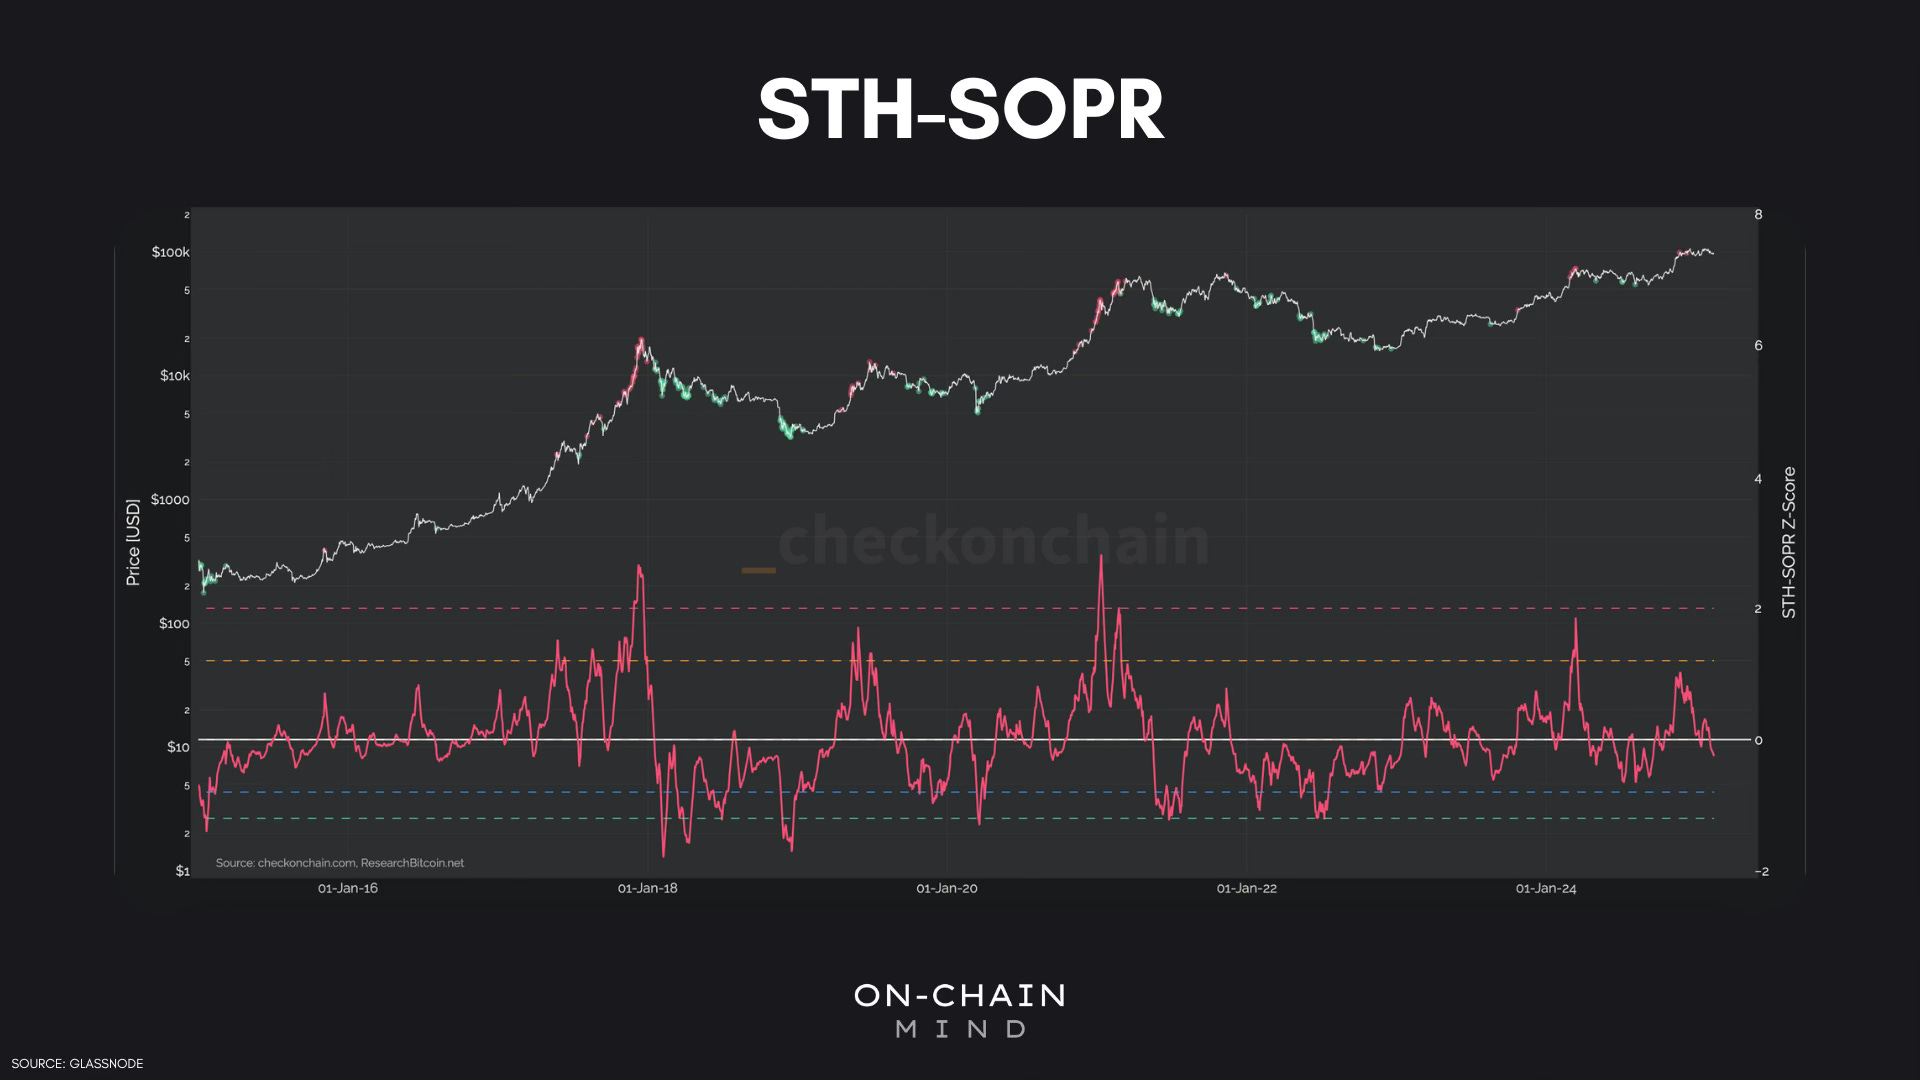
STH-SOPR, on the other hand, is more volatile and erratic, reflecting the behaviour of recent buyers. These investors are more sensitive to market fluctuations, making short-term SOPR a powerful tool for gauging real-time market sentiment. It’s particularly useful for identifying local tops and bottoms, as well as shifts in market structure.
Using SOPR in Bull and Bear Markets
SOPR is incredibly useful for detecting support and resistance levels:
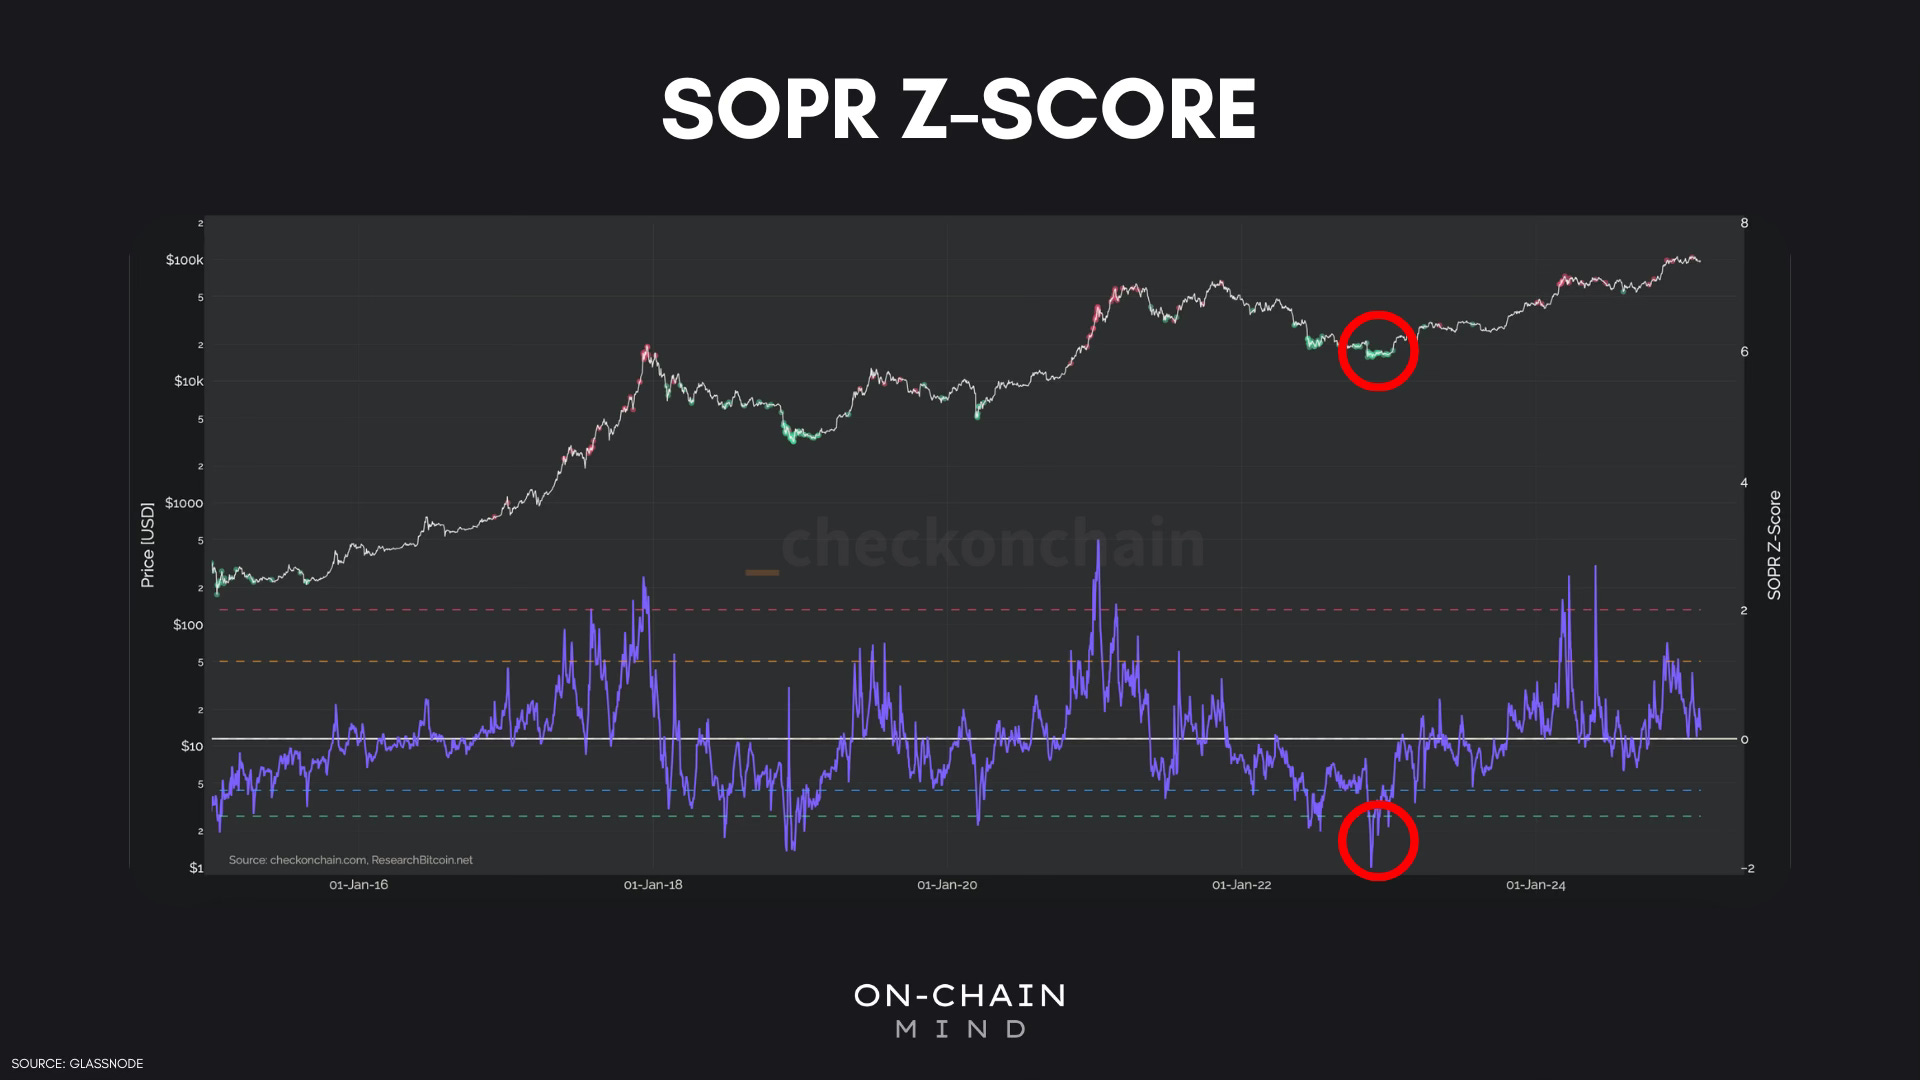
In bull markets, SOPR-Z often retests 0 as support, meaning investors are willing to buy the dip.
In bear markets, SOPR-Z retests 0 as resistance, meaning investors sell the rip.
Example: 2017 Bull Market
During Bitcoin’s 2017 bull run, SOPR-Z consistently bounced off 0, signaling strong buying interest.
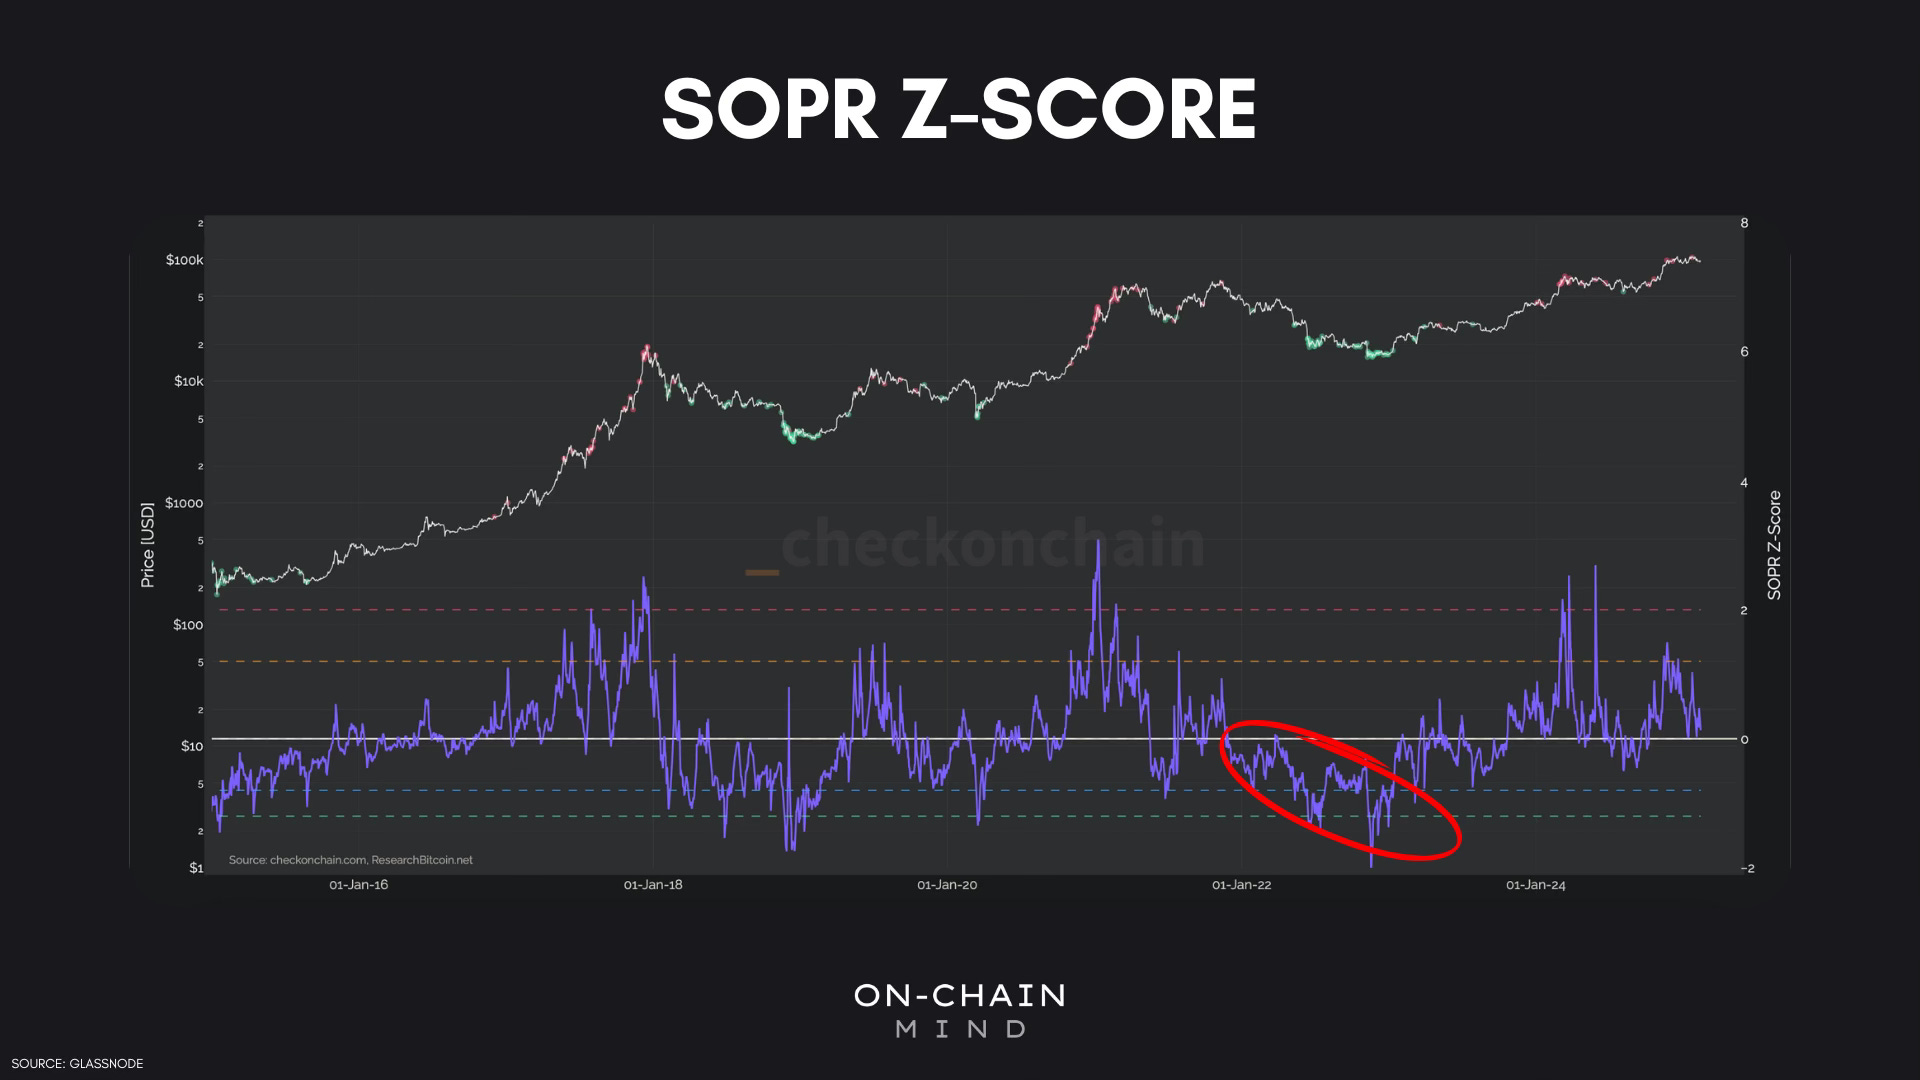
Example: 2022 Bear Market
During 2022’s prolonged downturn, SOPR-Z struggled to rise above 0, showing persistent sell pressure.
SOPR is valuable for spotting extreme market conditions, including both local and global highs and lows. When SOPR values are elevated, it suggests that investors are cashing out large profits, which can signal market saturation and potential peaks. Conversely, when SOPR values are low, particularly during capitulation, it indicates that sellers are running out of steam, potentially marking the market’s bottom. If SOPR-Z is failing to hold above 0, it often indicates that the market lacks bullish momentum.
Advanced Applications: Support, Resistance & Probability Bands
Beyond basic analysis, traders can use SOPR-Z to fine-tune entries and exits:
Retests of 0 can confirm market trends.
Extreme SOPR-Z values (far above or below 0) signal potential market tops and bottoms.
Probability bands (based on standard deviations) help assess risk:
SOPR-Z above 2 σ → Overheated market (red line below).
SOPR-Z below -1.2 σ → Capitulation event (green line below).
By combining these insights, traders can refine their risk management strategies and time their trades more effectively.

Why Short-Term SOPR is the Most Effective
Of all SOPR variants, Short-Term Holder SOPR is arguably the most important.
Why?
Short-term holders are the most reactive to price movements.
Their selling behavior dictates short-term price trends.
If short-term SOPR-Z breaks above 0, it often signals a trend reversal.
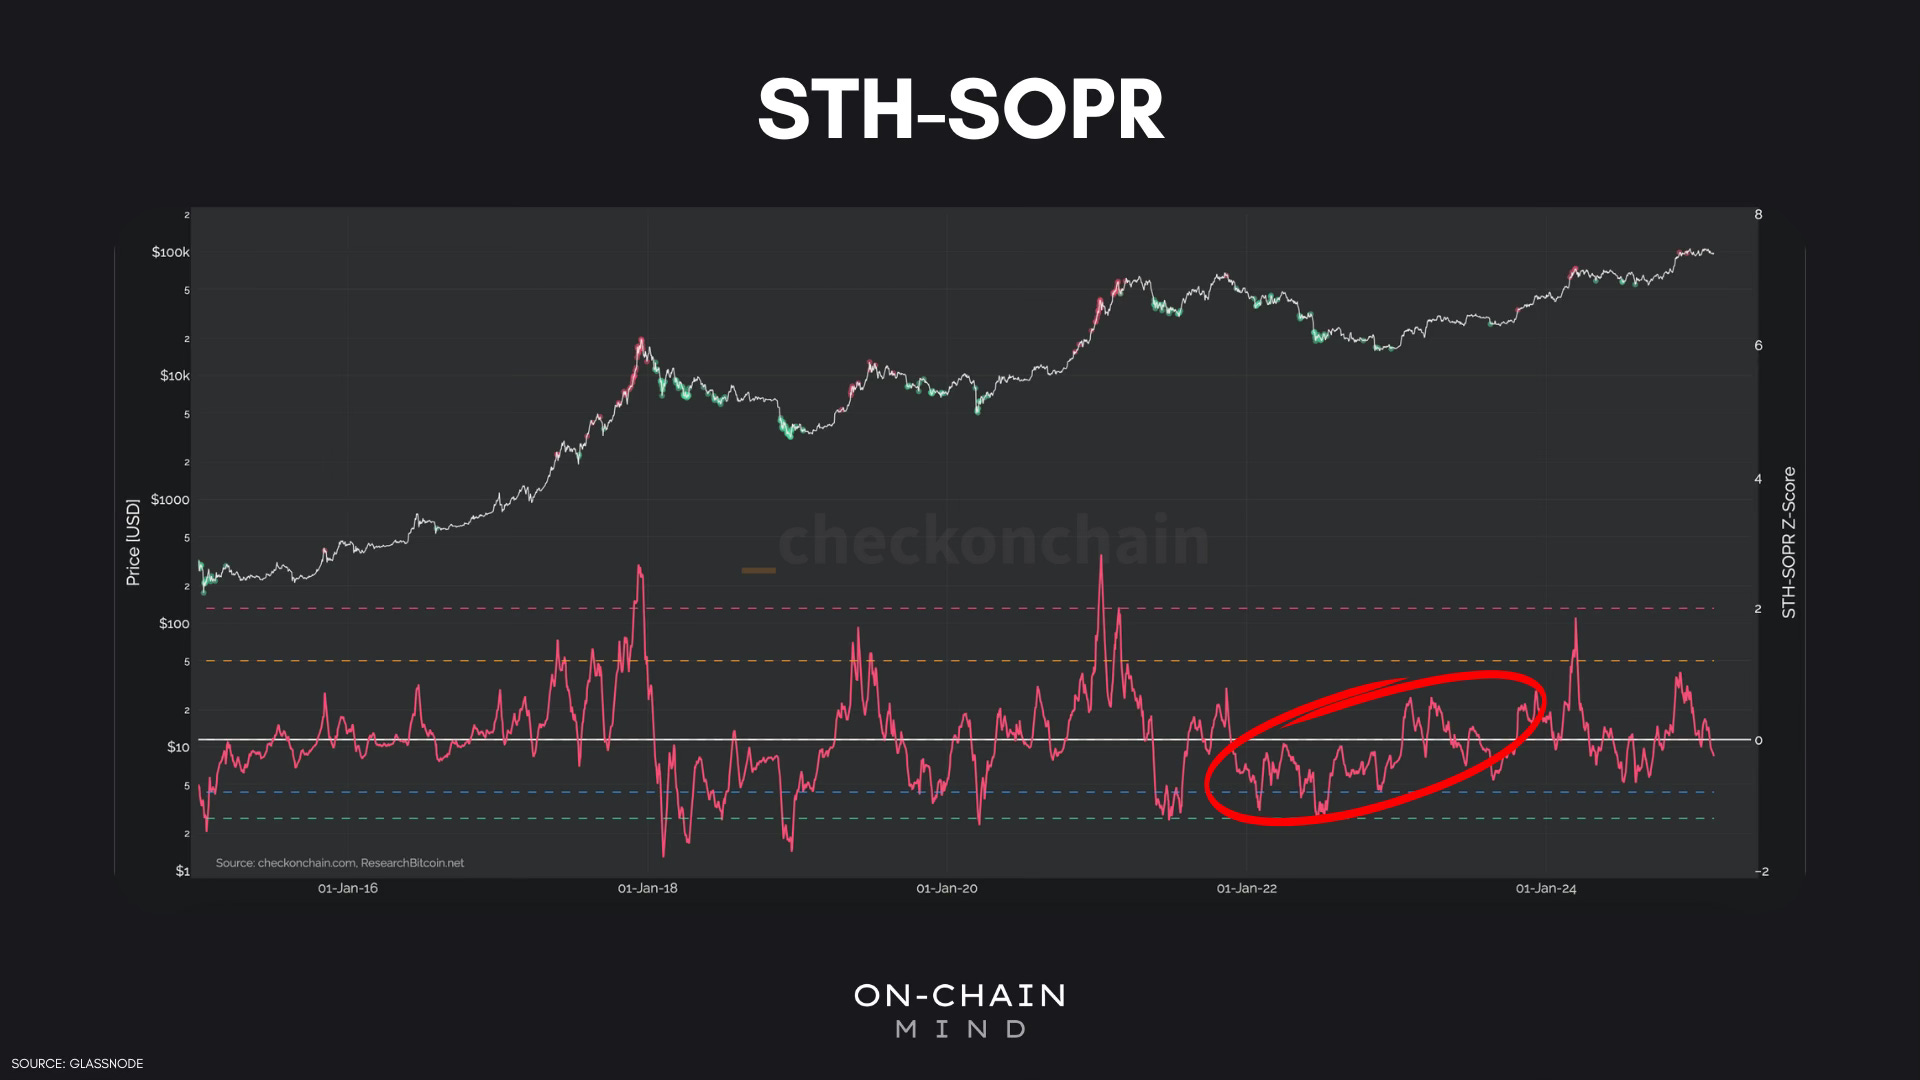
2023 Market Recovery
Throughout 2022, short-term SOPR-Z kept rejecting at 0, reinforcing the bear trend.
In early 2023, it broke above 0, confirming the shift to a bullish structure.
This is why traders closely watch short-term SOPR flips—they can signal the early stages of new market trends.
Key Takeaways
SOPR is a real-time indicator of investor behavior—it shows when investors are selling at a profit or a loss.
SOPR complements MVRV by tracking spent coins rather than unspent ones.
STH-SOPR is especially useful for spotting local market shifts.
Using SOPR alongside support/resistance and probability bands enhances trading decisions.
Pay attention to SOPR-Z flips around 0—these often signal trend reversals.
If you found this newsletter valuable, consider sharing it with others or leaving a comment below with your thoughts.
I’ll see you in the next one.
Cheers,
On-Chain Mind
Subscribe to the On-Chain Mind YouTube Channel!