

MSTR Is Deeply Undervalued
A Historically Rare Opportunity For a Continuing Bull Market

Hey everyone, and welcome back to the On-Chain Mind Newsletter.
MSTR is sitting at the most historically undervalued point in this bull market. For those with a data-driven approach and long-term patience, this could be the kind of opportunity that only comes around once in a market cycle.
In this article, I’ll break down 3 statistical indicators that reveal just how undervalued MSTR is today and model potential outcomes — both to the upside and the downside — based on past behaviour and the company’s Bitcoin accumulation strategy.
Let’s get into it.
Insights at a Glance:
Extreme Undervaluation Signals: MSTR is flashing statistically rare green dots on its 200-day MA Heatmap.
Probability-Driven Support: Z-Score analysis shows the stock is sitting at a historically strongly supported -2 standard deviation zone.
Momentum Exhaustion: Monthly Momentum readings suggest corrective phases may be nearing a bottom.
Asymmetric Upside: Even in conservative scenarios, potential upside materially outweighs downside risk.
200D MA: Identifying Extremes
The 200-day moving average (200D MA) is one of the most widely used technical tools in trading. By taking the average closing price of Bitcoin over the last 200 days, it provides a clear benchmark for long-term trend.
Price above the 200D MA typically signals bullish structures.
Price below the 200D MA generally suggests bearish conditions.
However, the true power comes when we examine deviation from the 200D MA, which is where the Heatmap concept shines:
Red/orange tones: Price stretched above the average — a sign of local overheating.
Green/blue tones: Price deeply below the average — historically marking some of the most compelling buying opportunities.
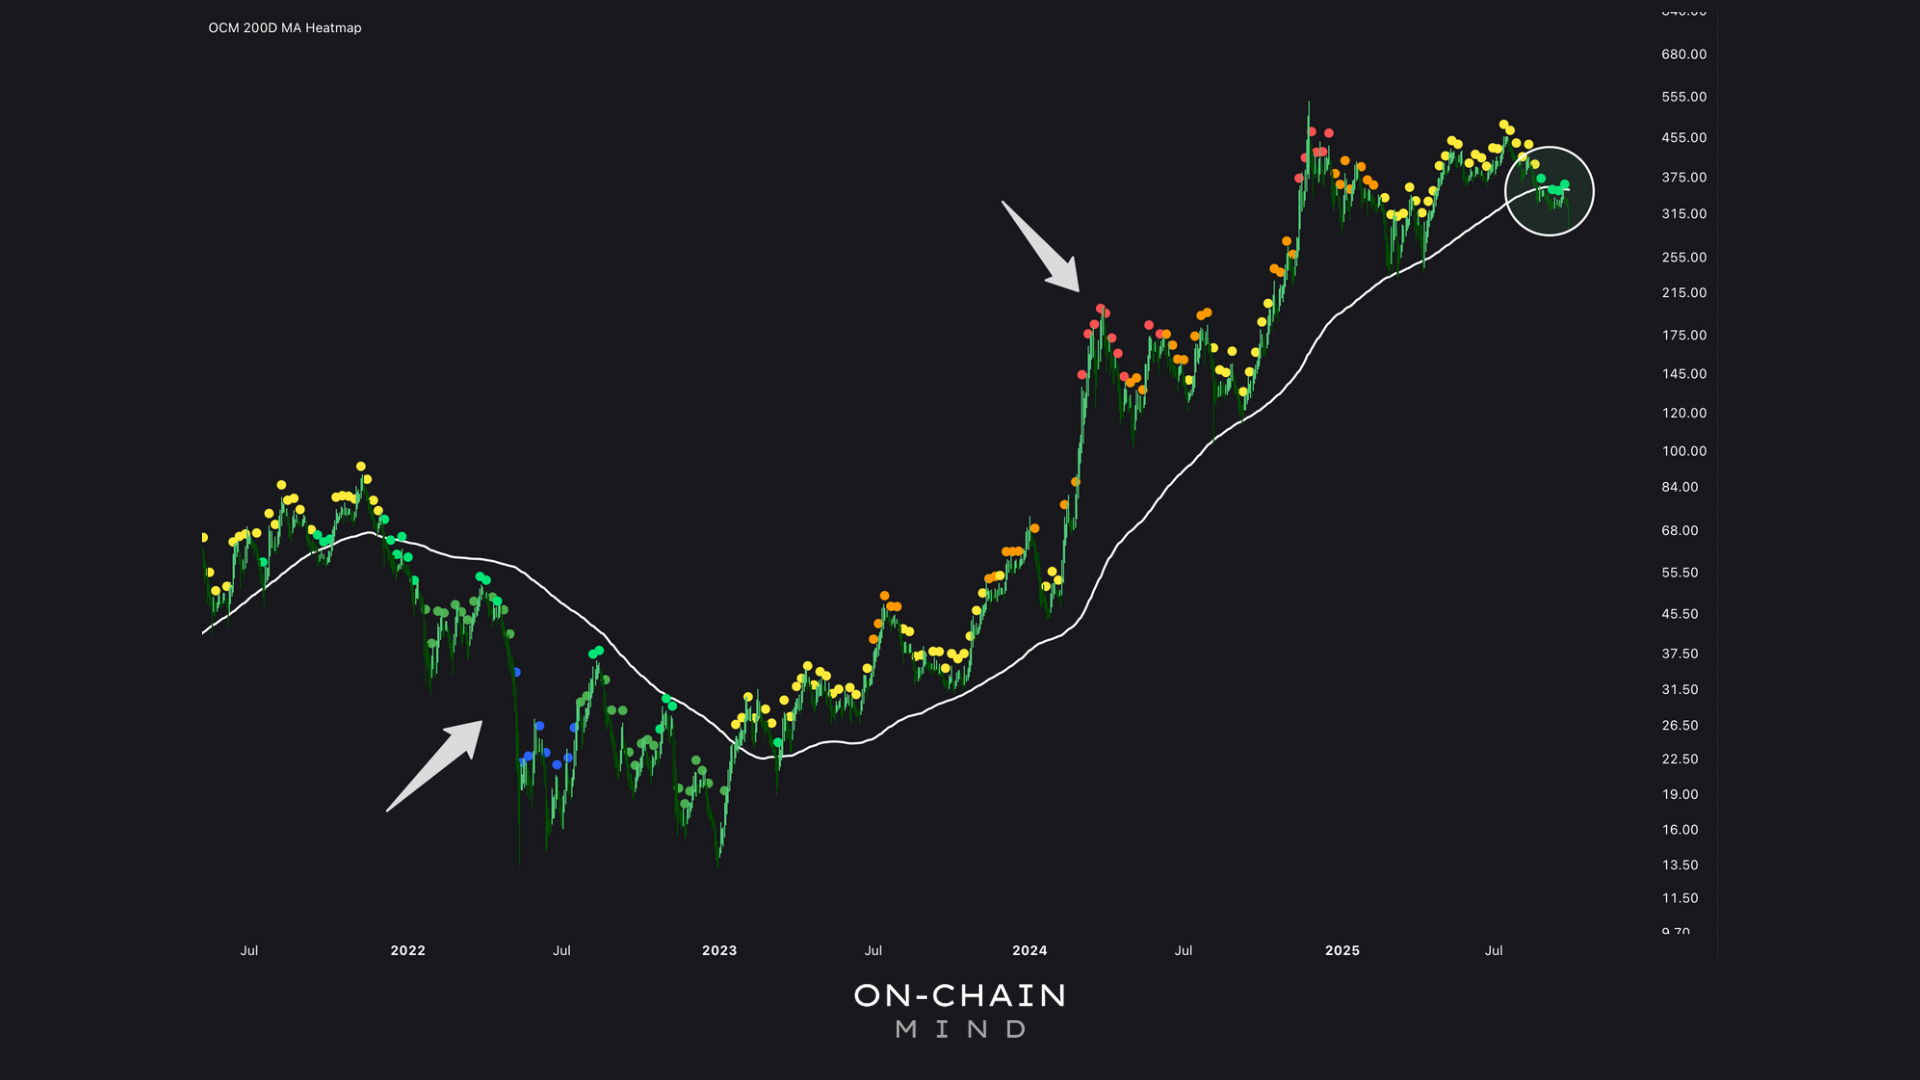
Currently, MSTR is showing its first green dots of this cycle. Historically, these appear in two scenarios:
Strong “buy-the-dip” moments within a continuing bull market.
Start of a bear market breakdown.
After analysing macro conditions, Bitcoin on-chain metrics, and previous cycles, the evidence leans toward the first scenario: MSTR is deeply undervalued within a longer-term uptrend, signalling an opportunity rather than the start of a collapse.
Z-Score Probability Waves: Framing Risk Statistically
The Z-Score Probability Waves is a statistical tool that measures how far price has deviated from its historical mean in terms of standard deviations. Unlike simple averages, the Z-Score quantifies the rarity of a move. And in financial contexts, it normalises volatility.
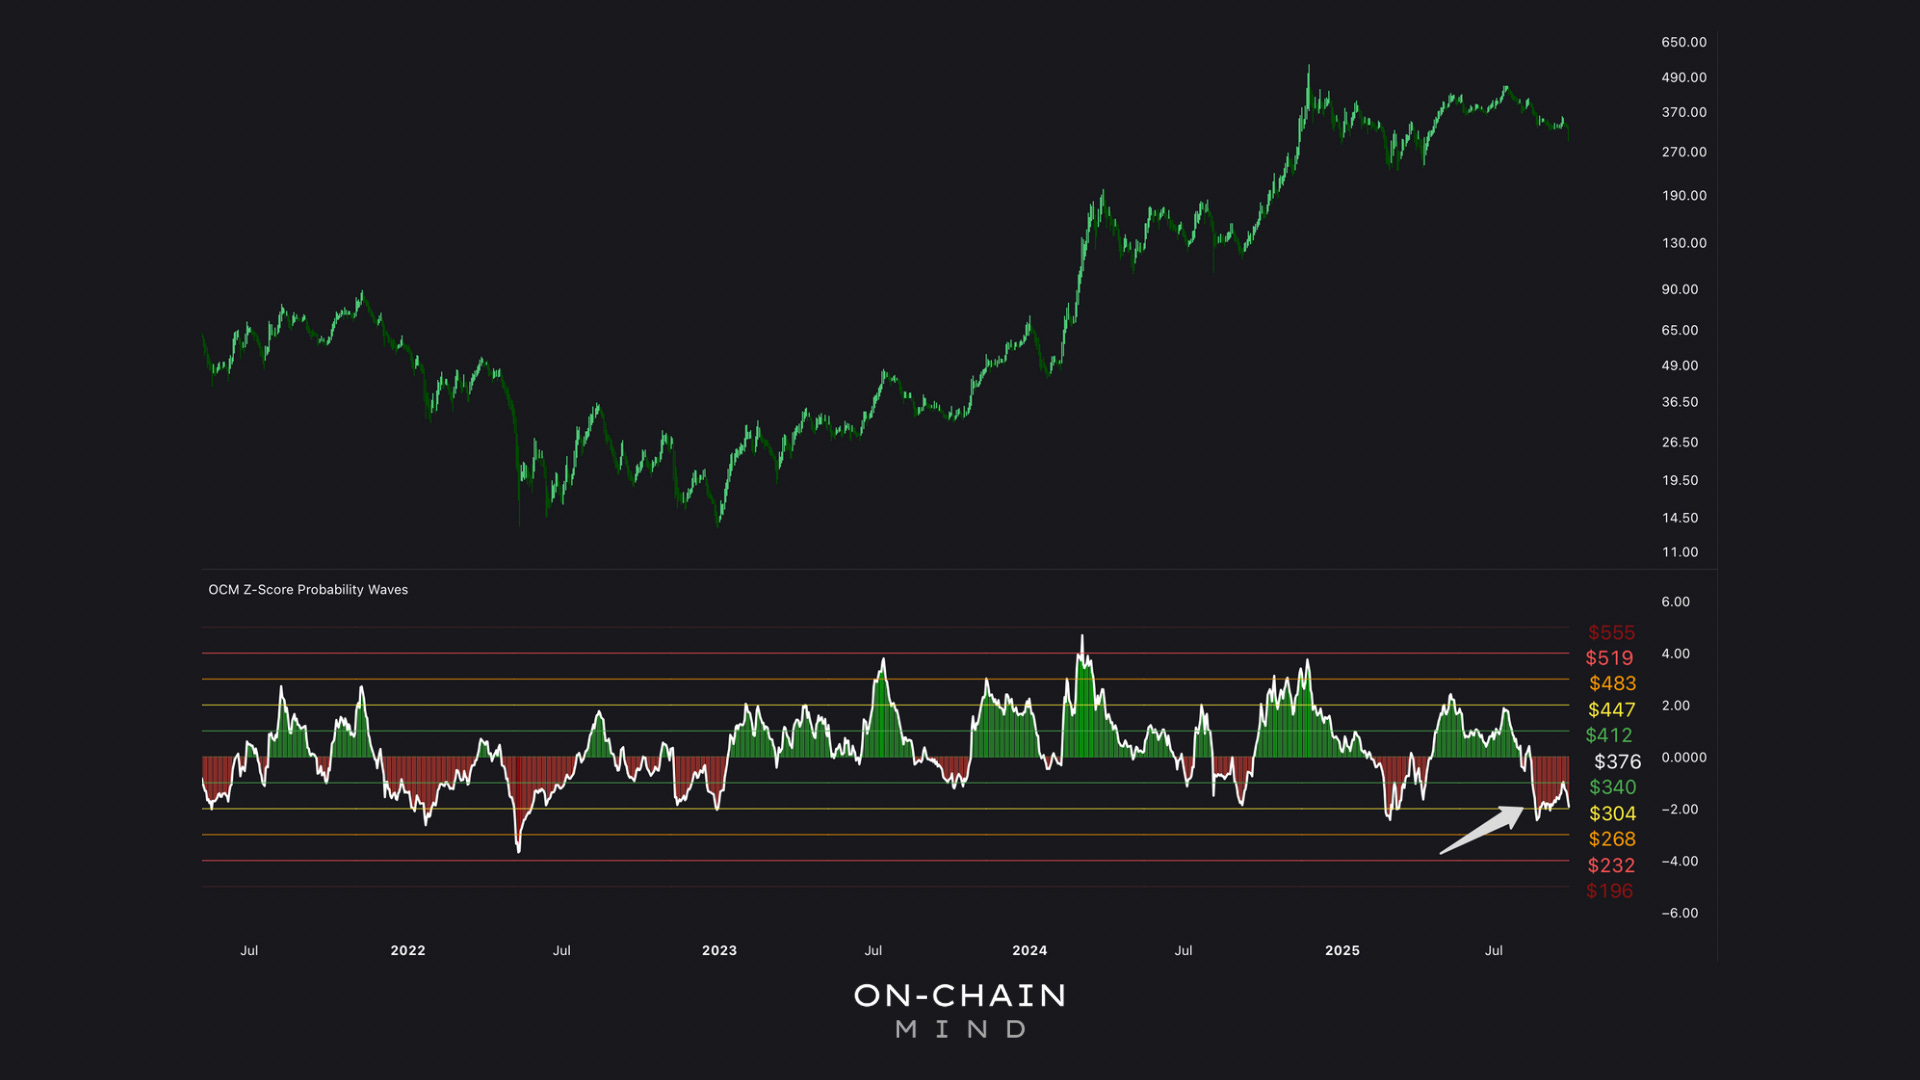
MSTR currently sits around -2 standard deviations, a level visited only twice before in this cycle. Historically, this level has acted as strong support, often preceding mean reversion events.
Even the theoretical worst-case scenario — a -3 standard deviation level — would place MSTR at around $268. While this is not impossible, history suggests that -2 is already deep enough to signal capitulation has likely occurred, making it a favourable entry point for patient, probability-minded investors.
The Z-Score approach removes guesswork. Rather than asking whether MSTR is “cheap or expensive”, we can quantify the statistical probability of downside and mean-reversion. In markets with supply dynamics like Bitcoin’s, rarity usually precedes correction — and in this case, the correction is likely upward.
Monthly Momentum: The Long-Term Market Trend
Our third indicator, the Monthly Momentum, strips away granularity to focus on structural health. It measures trend strength over a 30-day period and expresses price movement in percentage terms. This isn’t about daily volatility — it’s about structural phases in the market:
Positive momentum indicates a bullish trend.
Negative momentum signals a corrective or consolidating phase.
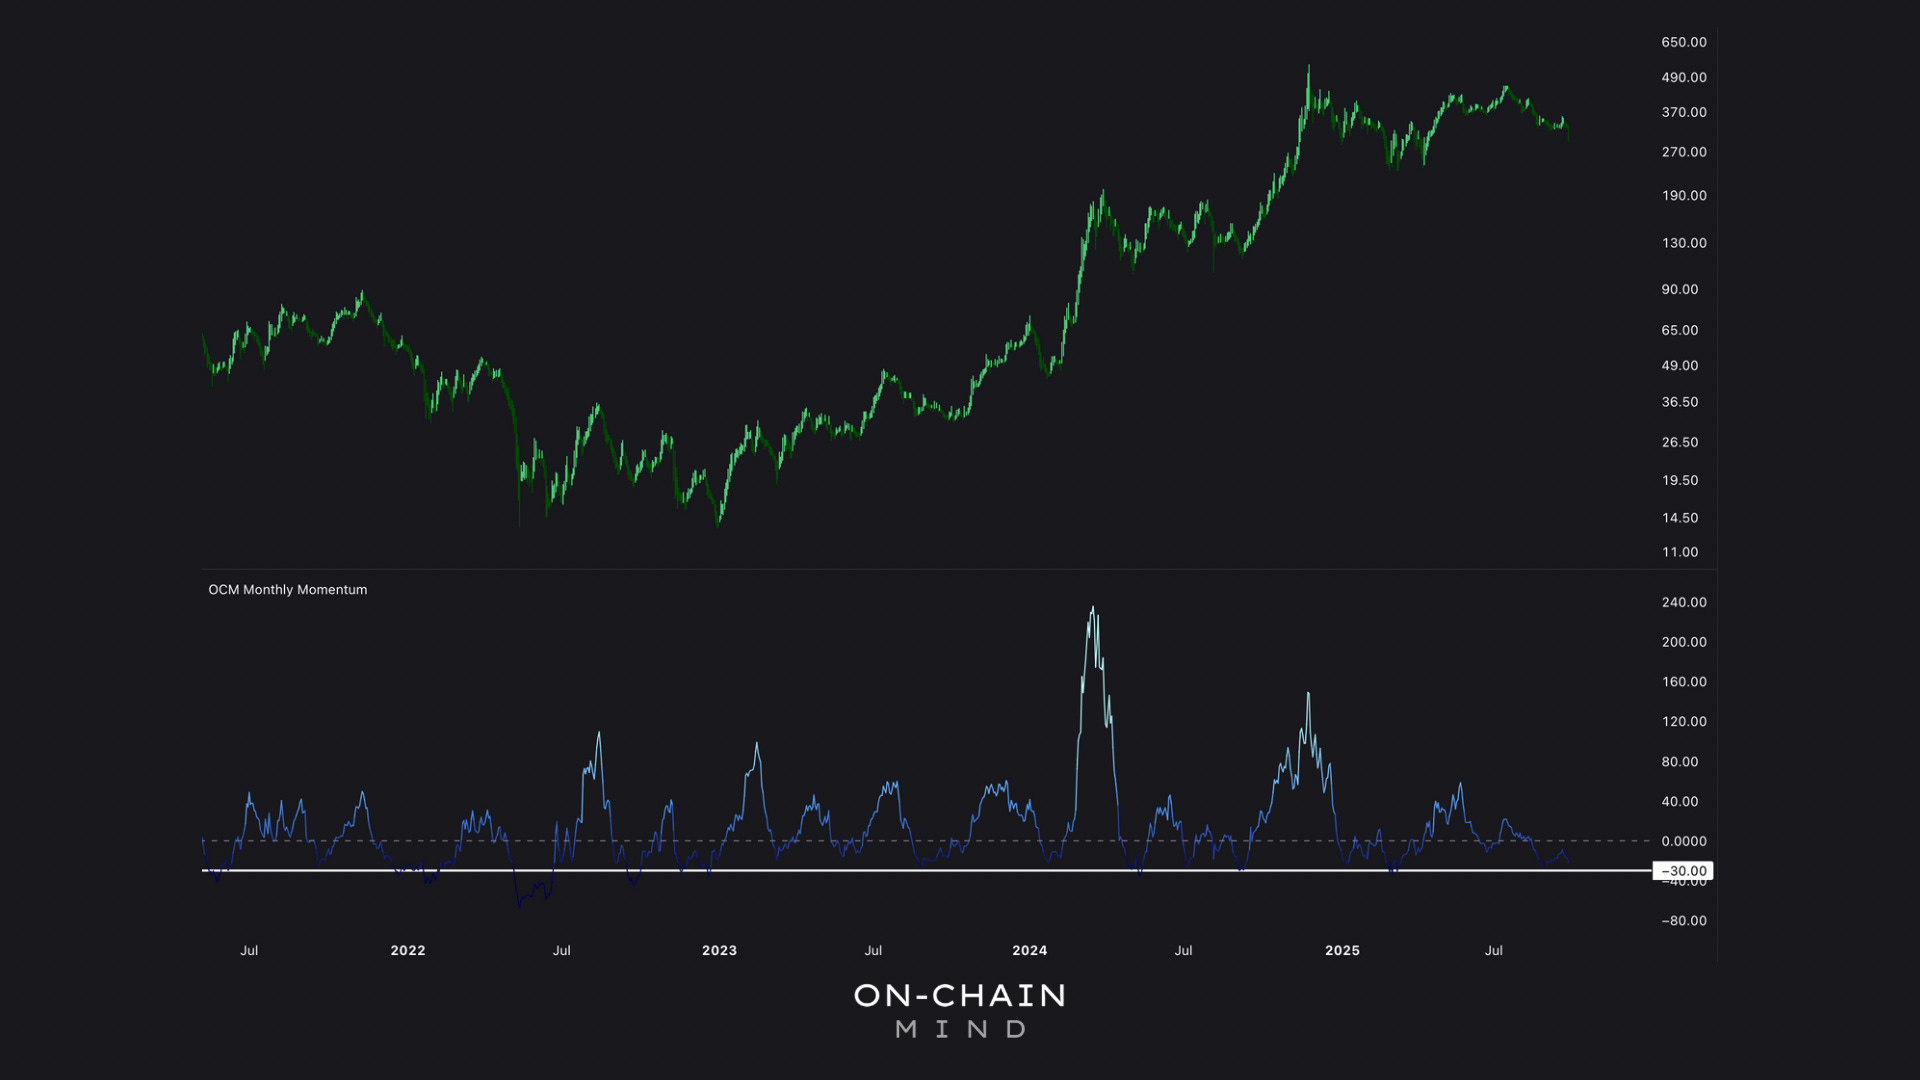
MSTR’s Monthly Momentum is currently around -30%, a level that has historically marked support and preceded reversals. It tells me that:
We’re in a corrective phase, not a runaway bull.
Bearish momentum is nearing exhaustion, potentially setting the stage for mean reversion.
Momentum isn’t predictive of exact timing, it’s about identifying structural phases. And if history repeats, or even rhymes, this could once again mark the point where bearish momentum exhausts itself and the trend begins to turn.
Price Predictions: Applying MSTR’s Bitcoin Strategy
Strategy’s Bitcoin blueprint adds another layer to the upside potential. Since their accumulation began, they’ve acquired roughly 10,000 Bitcoin per month on average, diluting shares by about 3,200 per month.
Assuming the current mNAV multiple (1.45) and Bitcoin around $109,000 remain:
Fair value: $328–$338 in 6–12 months.
Stress-testing other scenarios (accounting for continued accumulation):
Bearish case: mNAV compresses to 1.25x, Bitcoin at $100,000 → $259–$267.
Moderate upside: mNAV returns to 2x, Bitcoin at $124,000 → $514–$530.
Speculative cycle peak: mNAV at 3.5x, Bitcoin at $150,000 → $1,089–$1,122.

This demonstrates the asymmetric nature of MSTR: I firmly believe the downside is relatively capped while the upside has the potential for multi-bagger gains. Even modest appreciation in Bitcoin translates into outsized equity gains.
A Rare Statistical Alignment
Looking at MSTR and Bitcoin through the lens of these 3 independent, data-driven indicators, the picture becomes clear: we are in a rare phase of statistically significant undervaluation.
200-DMA Heatmap: Green dots signalling extreme undervaluation.
Z-Score Probability Waves: -2 standard deviation zone, historically linked to support.
Monthly Momentum: -30%, a historically strong bottoming signal.
Together, these metrics form a statistically rare confluence of opportunity. While nothing is guaranteed, probability and historical precedent both tilt the scales toward a meaningful upside.
While markets inherently carry uncertainty, the convergence of trend, probability, and momentum signals suggests a compelling potential upside — especially for investors with patience who can rise above short-term noise. That said, not every green dot is an automatic buy; interpreting these signals within the broader context is what separates opportunity from risk.
In my view, too many participants fixate on daily swings, losing sight of the cyclical and mean-reverting nature of these markets. MSTR isn’t just a volatile equity — it’s a window into Bitcoin’s broader structural trends, amplified by the company’s accumulation strategy and mNAV dynamics.
When we focus on the bigger picture and trust the statistical frameworks, we can see that the risk is more defined than many realise, while the potential reward is disproportionately large. I’ve got my hand on the buy button.
Key Takeaways
Rare Confluence of Indicators: The alignment of green heatmap dots, -2 Z-Score, and -30% momentum signals historic undervaluation, historically leading to upside.
Asymmetric Risk-Reward: Downside capped near $260, but upside could exceed $1,000 if Bitcoin and multiples expand.
Probabilistic Mindset: Shift from absolutes to probabilities; statistical extremes like these rarely persist without reversion.
Long-Term Focus: Ignore short-term volatility; Bitcoin’s fundamentals and MSTR’s strategy favour mean reversion in cycles.
If you want to unlock the full picture — including access to my Custom Indicator Suite — consider upgrading to Premium 🚀
I’ll catch you in the next one.
Cheers,
OCM
🎥 Watch the video of this article on YouTube!👇🏼
Subscribe to the On-Chain Mind YouTube Channel!
Thanks on chain. I looked at MSTR mnav in the prior cycle and it peaked in March of 2021 while Bitcoin price peaked November of 2021. The mnav for the later stage of the bull market deteriorated down to around 1.4 or so. What's your thoughts on this? Could we just be replaying that same playbook here? Late stage bull market where mnav just continued to compress.
Have been selling MSTR puts and am getting assigned shares this weekend. I feel it is undervalued and am very pleased to see your analysis. I’ll be holding the shares for the longer term.
I appreciate your work 👍🏼