


Navigating Bitcoin’s Cooldown Phase
A Data-Driven Approach to Short-Term Market Risk

Hey everyone, and welcome back to the On-Chain Mind Newsletter.
The Bitcoin market is never short on excitement. But behind the noise lies a pattern that has repeated itself across this cycle: sharp rallies, deep drawn-out pullbacks, then the next leg higher. The real challenge isn’t spotting the bull market—it’s identifying those short-term, asymmetric risk zones that offer a clear, data-driven edge—if you know where to look.
Let’s get into it.
Insights at a Glance:
The Rhythm of Risk: This cycle-aware model captures Bitcoin’s repeating short-term patterns, helping you cut through the noise.
Buying Where It Feels Worst: Low-risk zones often coincide with market discomfort—but offer the best upside.
Pain as Opportunity: Short-term holder losses reveal where sentiment bottoms out and reversals begin.
Discipline Over Emotion: A probabilistic, data-driven mindset consistently outperforms reactive decisions.
The Bitcoin Cycle: Patterns and Challenges
Bitcoin’s market cycles are a study in extremes. Sharp price surges often give way to extended consolidation or steep corrections (like we’re seeing now), creating a rollercoaster that rewards the disciplined and punishes the impulsive. While the pattern of rallies followed by cooldowns is familiar, timing these shifts is anything but straightforward. As the saying goes: “the trend is your friend”—until it isn’t. The difficulty lies in distinguishing sustainable momentum from overstretched euphoria.
Historically, Bitcoin’s bull markets feature explosive price bursts, often driven by retail enthusiasm or institutional inflows, followed by periods of profit-taking or market digestion. Yet, deciding when to reduce exposure during a rally or buy into a dip requires more than gut instinct—it demands a systematic, data-driven approach.
This is where the short-term risk model comes in. By integrating multiple data points, from traditional financial signals to on-chain metrics, we can assess short-term market risk with greater precision. The goal isn’t to predict the future but to tilt probabilities in your favour, identifying zones of opportunity and danger.
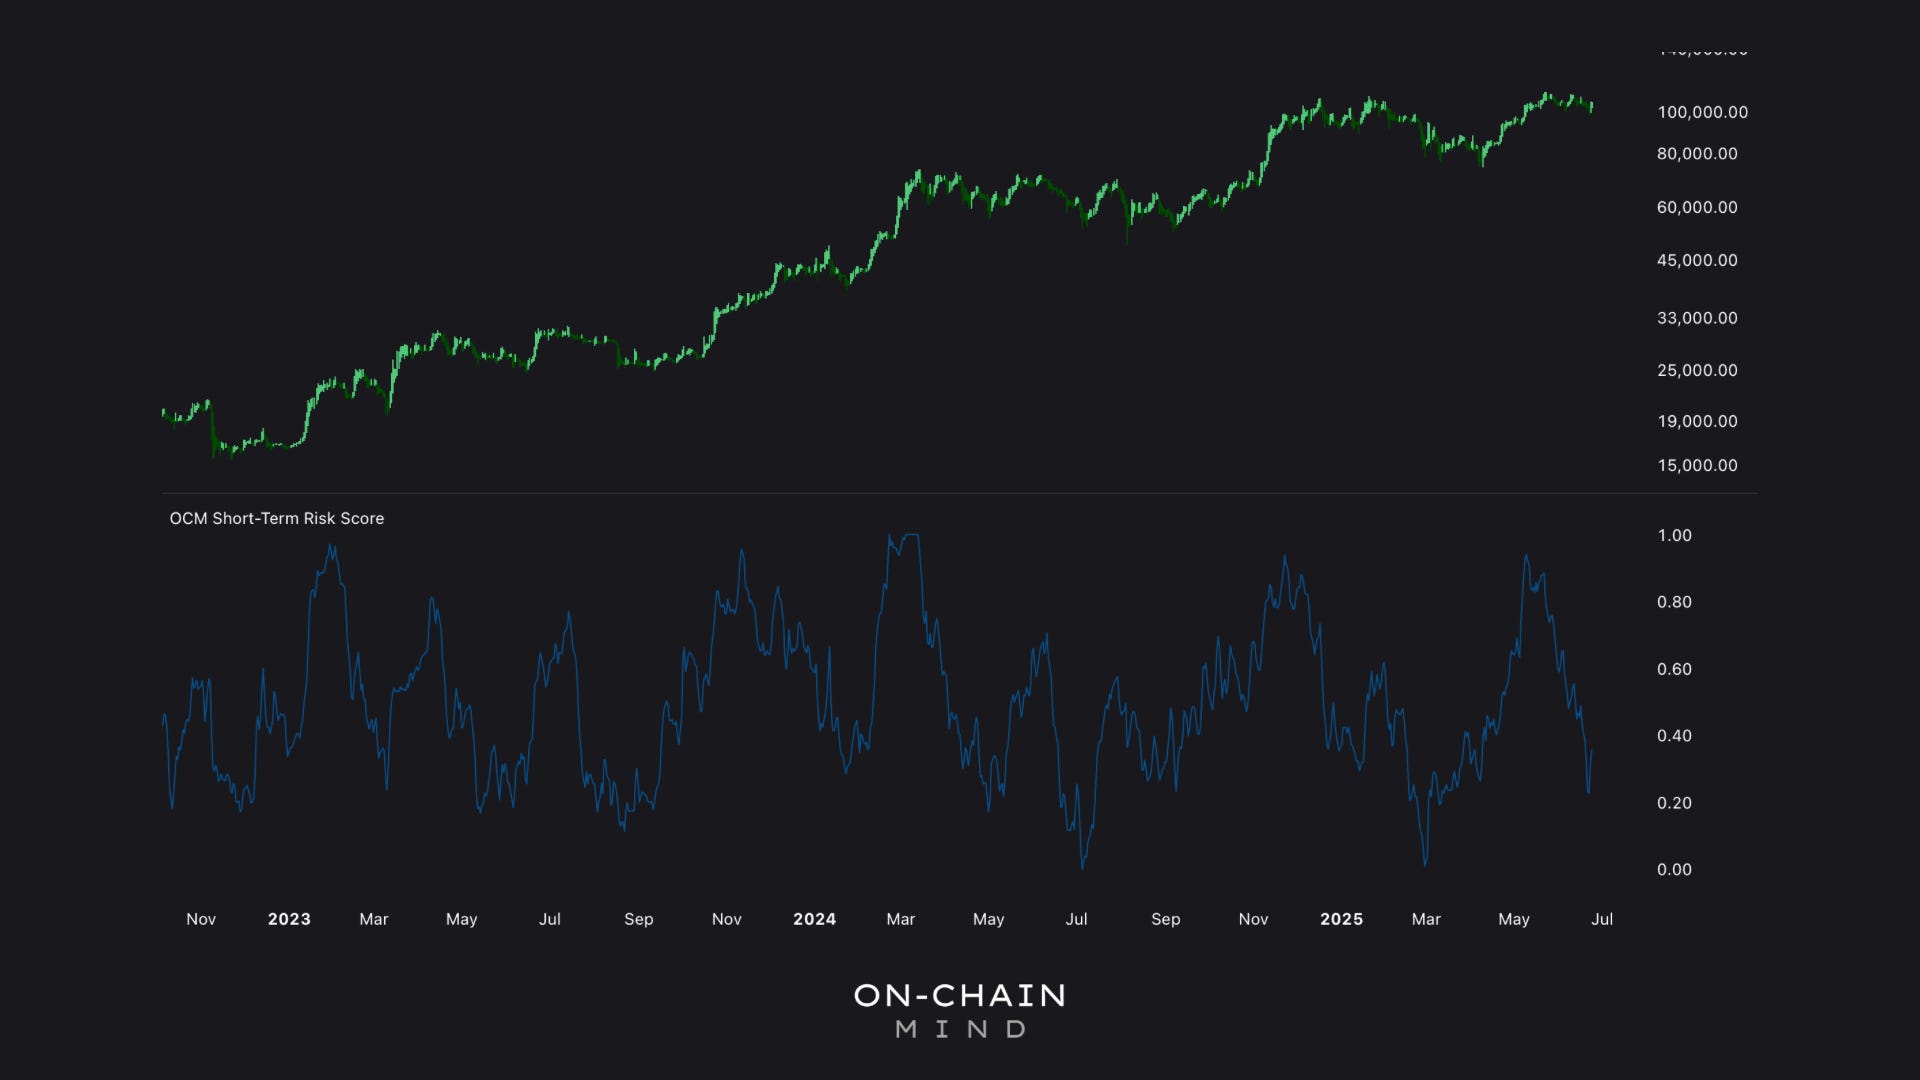
Short-Term Risk Score
The custom risk model discussed here is a composite score that blends 8 distinct metrics, each normalised and weighted based on historical performance across market regimes. This creates a cycle-aware indicator that highlights short- to medium-term risks and opportunities. Let’s break down its components.
1. Sharpe Ratio
A staple of traditional finance, the Sharpe Ratio measures risk-adjusted returns by comparing an asset’s performance to its volatility. For Bitcoin, this metric helps determine whether recent price movements are efficient or excessively erratic. A high Sharpe Ratio suggests steady gains with manageable volatility, while a low or negative ratio signals potential overextension.
2. Stablecoin Supply Ratio (SSR)
This on-chain metric compares Bitcoin’s price to the market capitalisation of major stablecoins (e.g., USDT, USDC). Stablecoins act as a proxy for liquidity in the crypto market, as traders often park capital in them during volatile periods. A rising ratio indicates Bitcoin’s price is outpacing stablecoin supply, often signalling local peaks, while a declining ratio highlights troughs.

3. MVRV Monthly Δ
The Market Value to Realized Value (MVRV) ratio compares Bitcoin’s market cap to the aggregate cost basis of all coins in circulation. The Monthly Delta variation tracks this deviation over a 30-day window, revealing whether the price has detached from the average investor’s entry point. Extreme highs suggest overvaluation, while lows indicate undervaluation.

4. Short-Term Holder MVRV
Focusing on investors holding Bitcoin for less than 155 days, this metric measures their unrealized gains or losses. Short-term holders are the market’s most reactive participants, prone to panic-selling or FOMO-driven buying. Their MVRV provides insight into sentiment at critical inflection points.

5. SOPR-Z Score
This metric analyses whether coins are being spent at a profit or loss, offering an early signal of sentiment shifts. When holders sell at a profit en masse, it often precedes corrections. Conversely, widespread loss-taking can mark capitulation and buying opportunities.

6. Mayer Multiple
The Mayer Multiple compares Bitcoin’s price to its 200-day moving average, offering a macro view of whether the market is overstretched or suppressed. A high multiple often signals euphoria, while a low multiple indicates undervaluation.

7. Velocity RSI
An adaptation of the Relative Strength Index, the Velocity RSI measures the momentum of price acceleration. By focusing on short-term overextensions, it helps identify when rallies are losing steam or when dips are stabilising.
8. Microstructural Risk
This custom metric uses the Average True Range (ATR) and local drawdown analysis, adjusted for macro-cycle trends, to detect volatility extremes. It ensures the model accounts for both short-term fluctuations and broader market context.
Each metric is normalised to a common scale (0-100) and blended using weightings optimised for historical accuracy. The result is a composite risk score that ranges from 0% (extreme undervaluation) to 100% (extreme overvaluation), providing a clear, multidimensional view of market risk.
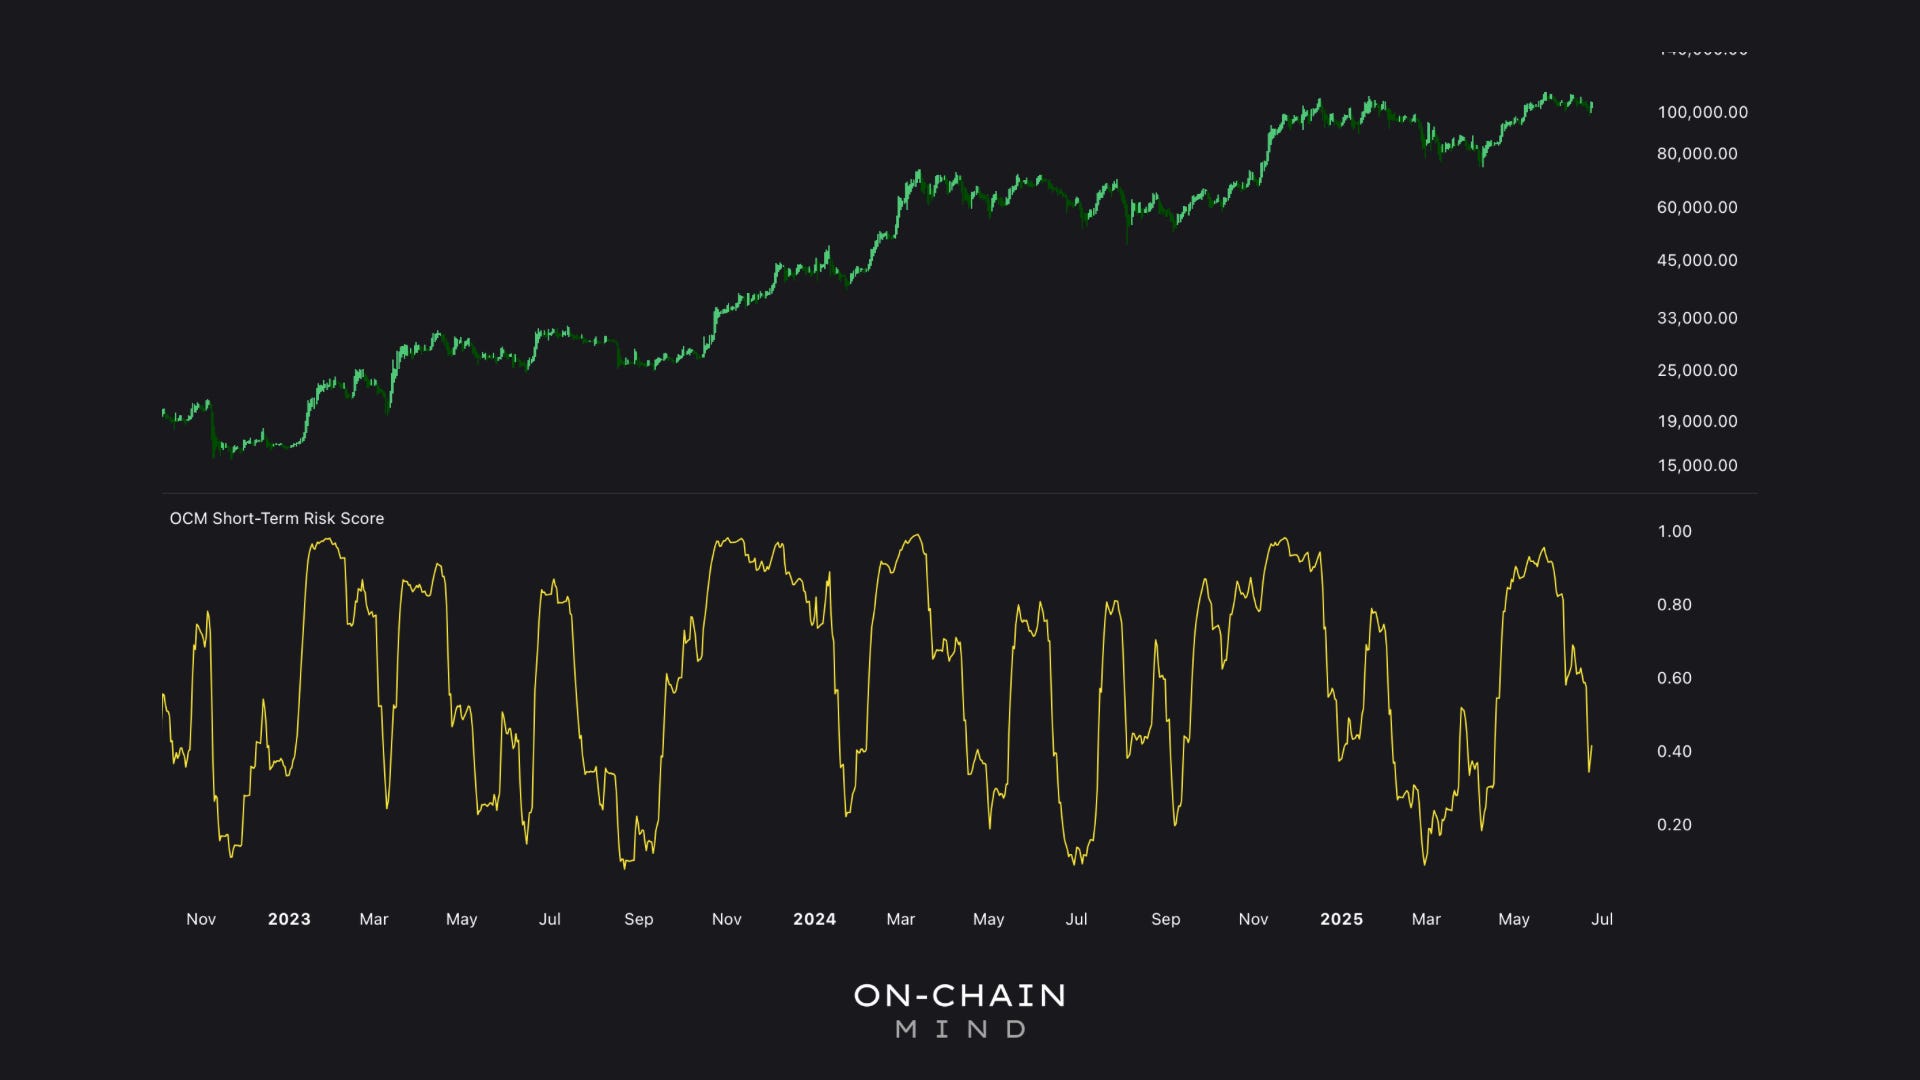
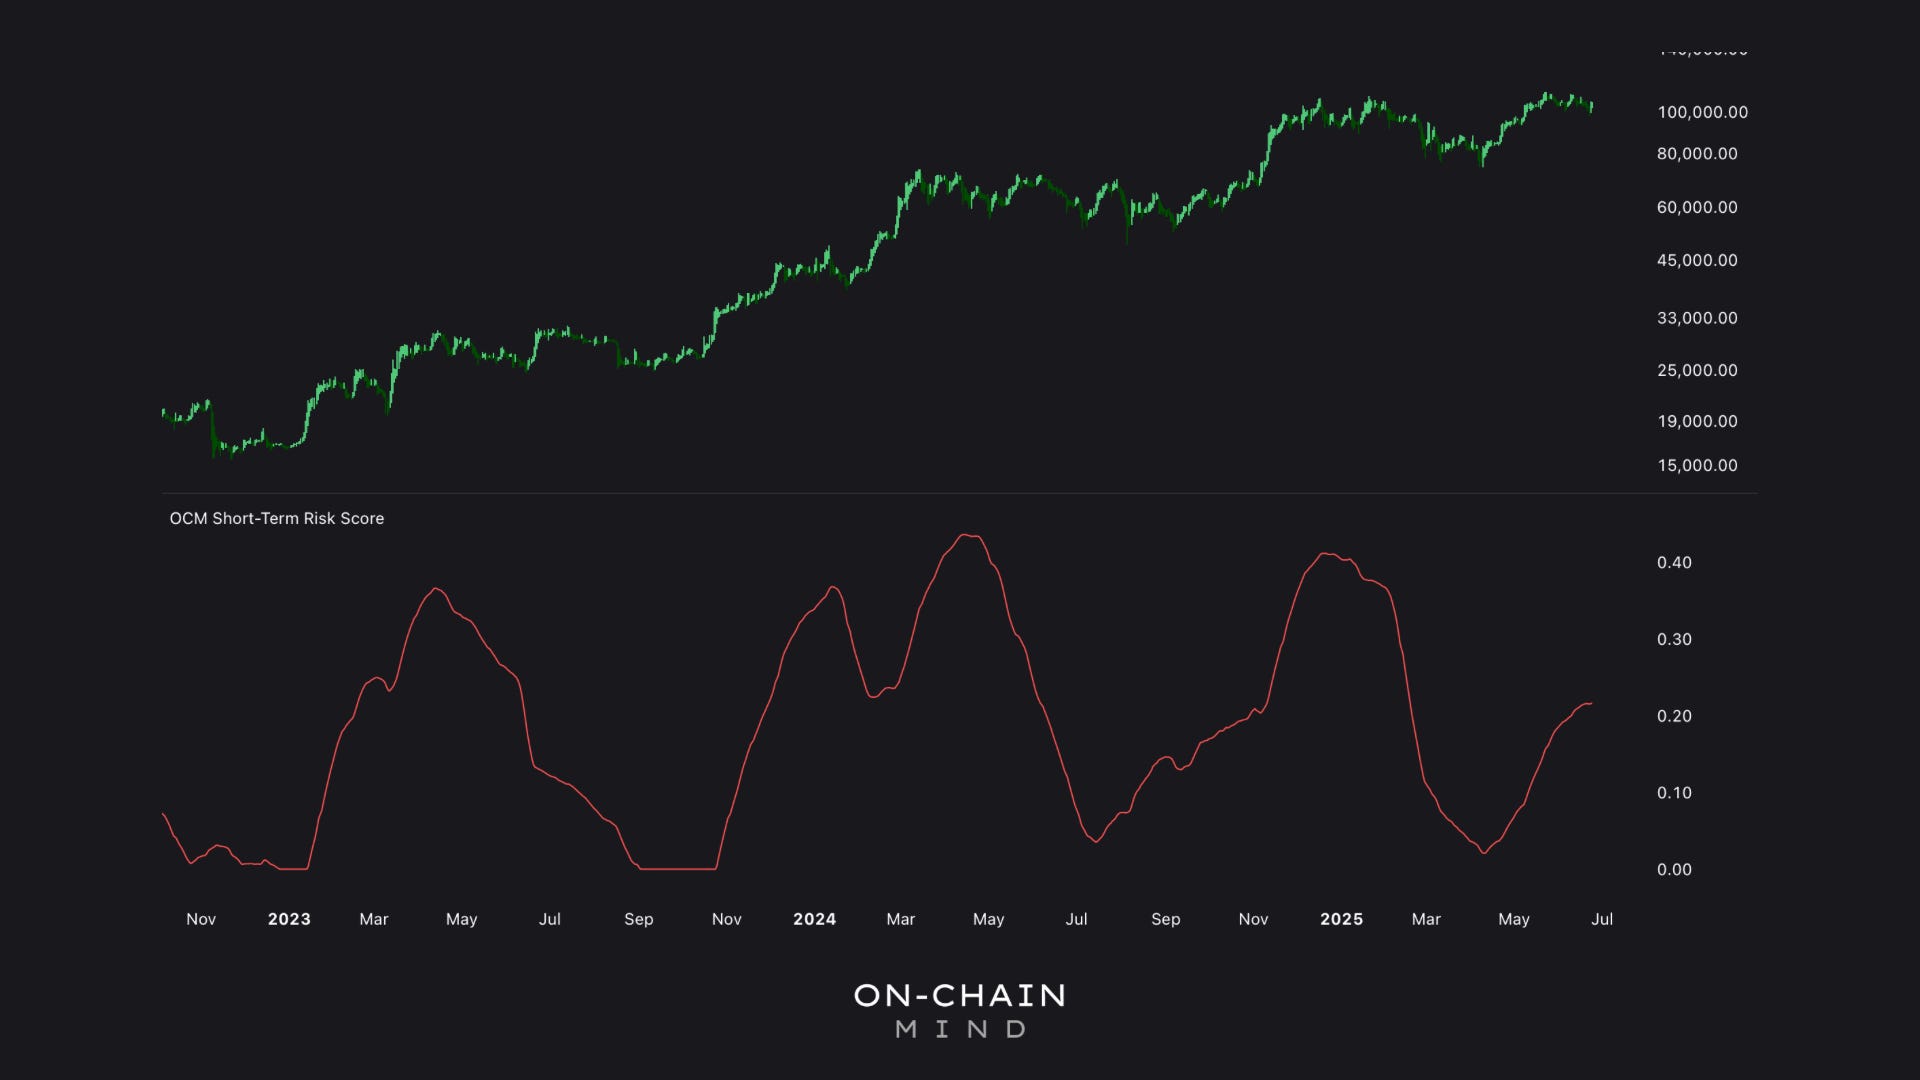
Interpreting the Risk Score: Zones of Opportunity and Danger
The short-term risk model’s strength lies in its ability to identify actionable zones. Historical analysis shows that when the composite score exceeds 70%, the likelihood of a short- to medium-term correction rises significantly. However, Bitcoin’s momentum can carry prices higher even in high-risk zones, making premature exits costly. Conversely, scores below 30% signal asymmetric buying opportunities, where the risk-reward ratio heavily favours upside potential.

Currently, the risk score sits at approximately 43%, placing Bitcoin in a “favourable accumulation zone”. This suggests the market is digesting recent gains, with volatility subdued and sentiment cautious. The trend is slightly downward, hinting at further improvement in risk-reward dynamics as consolidation continues. Notably, the $100,000 price level is now viewed as a medium-to-low risk zone, indicating market acceptance of this range as a potential base for future gains.
Practical Application
The short-term risk score offers a framework for disciplined decision-making:
Above 70%: Scale back exposure or pause new buys, as correction risks rise.
Below 50% (white midline): Increase allocations, especially for dollar-cost averaging strategies.
Below 30%: Aggressively accumulate, as these are historically the best entry points.
This probabilistic approach doesn’t require predicting exact tops or bottoms. Instead, it encourages patience and systematic allocation based on data-driven signals.
The Short-Term Holder Cost Basis: A Complementary Signal
While the risk model provides a broad view, the short-term holder cost basis offers a granular perspective on market sentiment. This indicator tracks the average entry price of investors holding Bitcoin for < 155 days—the cohort most likely to react emotionally to price swings. When their cost basis exceeds the current price, these holders face unrealized losses, often marking local bottoms.
By overlaying standard deviation clouds on this metric, we can visualise how statistically stretched the price is relative to short-term holders’ entries. The orange and red bands represent extreme short-term undervaluation, where buying conditions are optimal. Historically, these zones coincide with consolidation phases before significant rallies.

Currently, Bitcoin’s price hovers near the short-term holder cost basis, suggesting some reactive traders are experiencing mild losses. This aligns with the risk score’s indication of an accumulation zone, reinforcing the idea that the market is in the late stages of a cooldown. If the risk score remains stable or trends lower, Bitcoin could be poised for another leg higher, potentially challenging previous all-time highs.
The Bigger Picture: Probabilistic Investing in Bitcoin
Bitcoin’s volatility demands a mindset rooted in probabilities, not certainties. Markets rarely move in straight lines, and shakeouts are inevitable. By combining the risk model with the short-term holder cost basis, you can navigate these fluctuations with greater clarity. The current setup—risk score at 43%, price near the short-term holder cost basis, and subdued volatility—suggests a constructive outlook. The market’s acceptance of $100,000 as a medium-to-low risk level further supports the case for a potential base-forming phase.
From a long-term lens, this is a moment for patience and discipline. Dollar-cost averaging can be refined by weighting allocations toward low-risk zones, while traders can use the risk score to time entries and exits. The key is to avoid emotional reactions and let data guide your decisions.
Key Takeaways
Data-Driven Discipline: The multi-factor risk model provides a robust framework for assessing short-term market risk, blending traditional and on-chain metrics for a comprehensive view.
Strategic Timing: High-risk zones (above 70%) signal caution, while low-risk zones (below 30%) offer asymmetric buying opportunities.
Short-Term Holder Insights: Monitoring reactive traders’ cost basis helps identify local bottoms, complementing the risk model’s broader perspective.
Patience Pays: In Bitcoin’s volatile cycles, a probabilistic, systematic approach maximises returns while minimising emotional pitfalls.
If you want to unlock the full picture — including access to my Custom Indicator Suite — consider upgrading to Premium 🚀
I’ll see you in the next one.
Cheers,
On-Chain Mind
🎥 Watch the video of this article on YouTube!👇🏼
Subscribe to the On-Chain Mind YouTube Channel!