

Where Will Bitcoin Top This Cycle?
A Data-Driven Look at 6 Proven Indicators

Hey everyone, and welcome back to the On-Chain Mind Newsletter. If you’ve spent any time in the Bitcoin world, you’ve heard the question a thousand times:
“Where will Bitcoin top out this cycle?”
And let’s be real—most answers are garbage. Between Twitter fortune tellers and YouTube thumbnails promising $1 million BTC, it’s easy to get swept up in the noise.
But there’s a better way.
In this article, we won’t speculate. Instead, we’ll break down six metrics with a strong track record of calling previous Bitcoin cycle tops. These aren't just popular trading tools—they're built on network fundamentals, investor behaviour, and historical precedent. Most importantly, they’ve worked before. By the end, you’ll not only understand how to interpret these metrics, but also how to use a composite of them to build a smarter, data-backed exit strategy.
Let’s get into it.
Insights at a Glance:
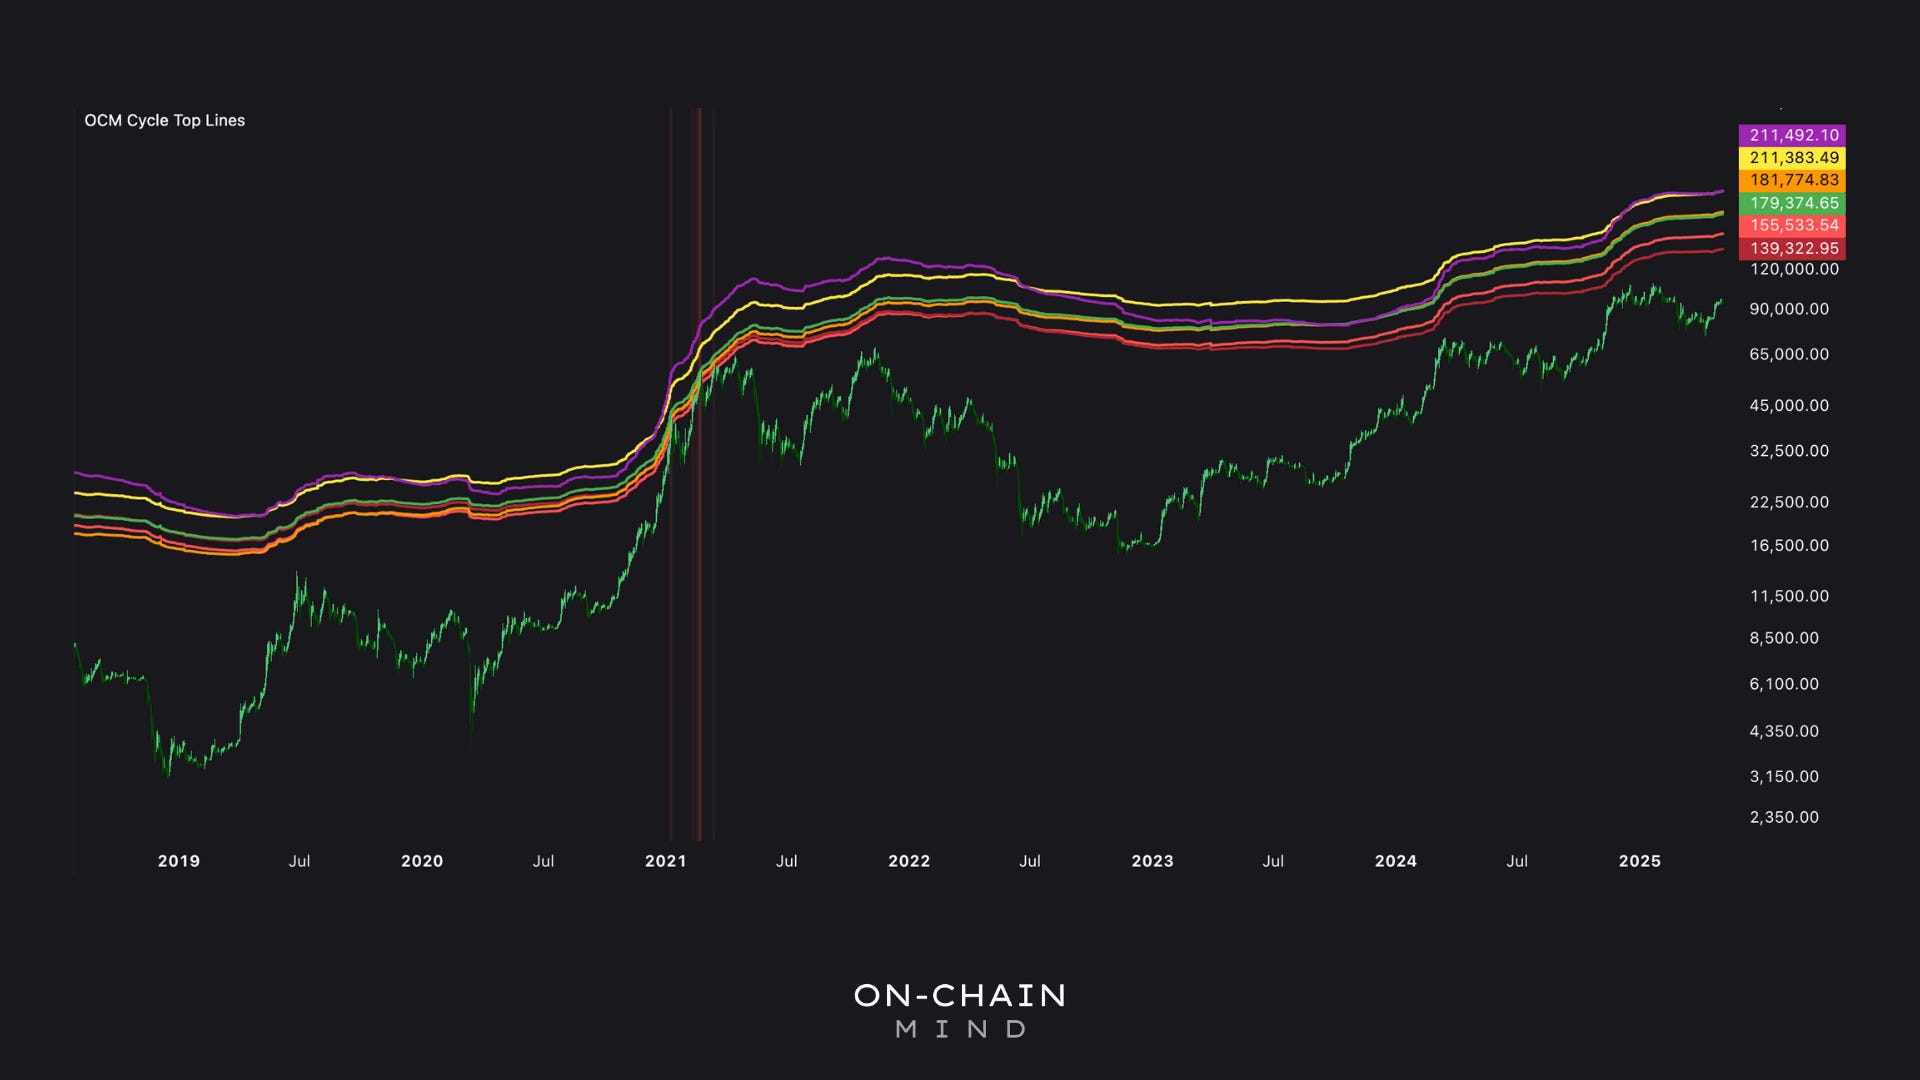
Dynamic metrics: Six historically reliable metrics suggest a range of $139,000–$211,000 for the next Bitcoin top.
Putting it all together: A composite average of all indicators currently sits at ~$179,000.
Historical patterns matter: Past tops have occurred when these indicators begin to converge—watch for that.
Confluence is key: Using a multi-metric approach beats relying on gut instinct or hype.
Why Predicting Bitcoin’s Top Is So Hard
Let’s face it, price predictions are everywhere, and most are useless. Why?
They rely on hype, not data
They ignore Bitcoin’s historical cycles
They don’t account for human behaviour in markets
The challenge lies in Bitcoin’s unique nature. Unlike traditional risk assets, Bitcoin operates on a decentralized blockchain, where price is driven by a complex interplay of market psychology, network activity, and long-term holder behaviour. This is where on-chain metrics—data derived directly from the blockchain—come in. These metrics offer a window into the network’s health and investor behaviour, providing clues about when a cycle might be reaching its peak.
In this article, we’ll explore six on-chain and market-derived indicators that have consistently flagged Bitcoin cycle tops in the past. By understanding these tools, their historical performance, and how they converge, you’ll gain a framework to navigate Bitcoin’s volatility with rationality, not emotion. Let’s dive into the metrics and uncover what they reveal about Bitcoin’s next potential top.
The 6 Metrics That Have Called Tops Before
1. Terminal Price:
The Terminal Price is a theoretical upper bound for Bitcoin’s price, calculated based on the cumulative value transferred across the network and Bitcoin’s age. Think of it as a “mature” ceiling that reflects the network’s historical growth.
How it works: It combines the total value moved on-chain with Bitcoin’s time in existence, creating a price level that historically marks overheated market conditions.
Why it matters: In past cycles (2013, 2017, 2021), Bitcoin’s price touched or slightly exceeded the Terminal Price before reversing. It’s a reliable gauge of when the market is stretched.
2. Coin Value Elevation (CVE):
The Coin Value Elevation is my custom metric that extends the Coin Value Days Destroyed (CVDD) indicator, adjusting for Bitcoin’s age and long-term holder activity.
How it works: CVE tracks the value of coins moved by long-term holders, scaled exponentially to reflect Bitcoin’s maturing market. It stretches upward during euphoric phases, capturing FOMO-driven price spikes.
Why it matters: By focusing on long-held coins, CVE highlights moments when even the most convicted holders start selling, a hallmark of cycle tops.
3. 5x Balanced Price:
The 5x Balanced Price multiplies the Balanced Price—a blend of Realized Price (average cost basis of all coins) and Terminal Price—by five to estimate speculative tops.
How it works: It balances long-term network fundamentals (via Terminal Price) with short-term investor behavior (via Realized Price), projecting a reasonable overvaluation level.
Why it matters: This metric has consistently aligned with cycle peaks, capturing the point where speculative fervor pushes prices beyond fundamentals.
4. 4x Adjusted Realized Price:
This metric refines the traditional Realized Price by factoring in the Spent Output Profit Ratio (SOPR) and transaction volume, then multiplies it by four.
How it works: The Adjusted Realized Price smooths out noise in the raw Realized Price, focusing on coins sold at high profits. The 4x multiple projects a top based on historical profit-taking patterns.
Why it matters: It signals when the majority of Bitcoin holders are cashing out at significant gains, a precursor to cycle tops.
5. 4.5x Coin Value Days Destroyed:
This metric multiplies the original Coin Value Days Destroyed (CVDD) by 4.5 to estimate cycle tops based on the movement of long-held coins.
How it works: CVDD measures the “destruction” of coin value when dormant coins are sold. The 4.5x multiple aligns with historical tops where long-term holders capitulate.
Why it matters: Sudden sales of old coins often signal euphoria, as even “diamond hands” cash out during blow-off tops.
6. Delta Top:
The Delta Top is a niche but powerful metric, calculated as seven times the difference between the Realized Price and a time-adjusted average market cap.
How it works: It focuses on psychological blow-off tops, where prices surge far beyond fair value due to irrational exuberance.
Why it matters: Delta Top often tags the most extreme peaks, aligning with euphoric surges before sharp corrections.
What the Metrics Are Saying Today
As of May 2025, these six metrics provide a range of price predictions for Bitcoin’s potential cycle top, from $139,000 (Coin Value Elevation) to $211,000 (5x Balanced Price and Delta Top). This spread reflects the current market’s uncertainty, with Bitcoin in a choppy, range-bound phase rather than full-blown euphoria.
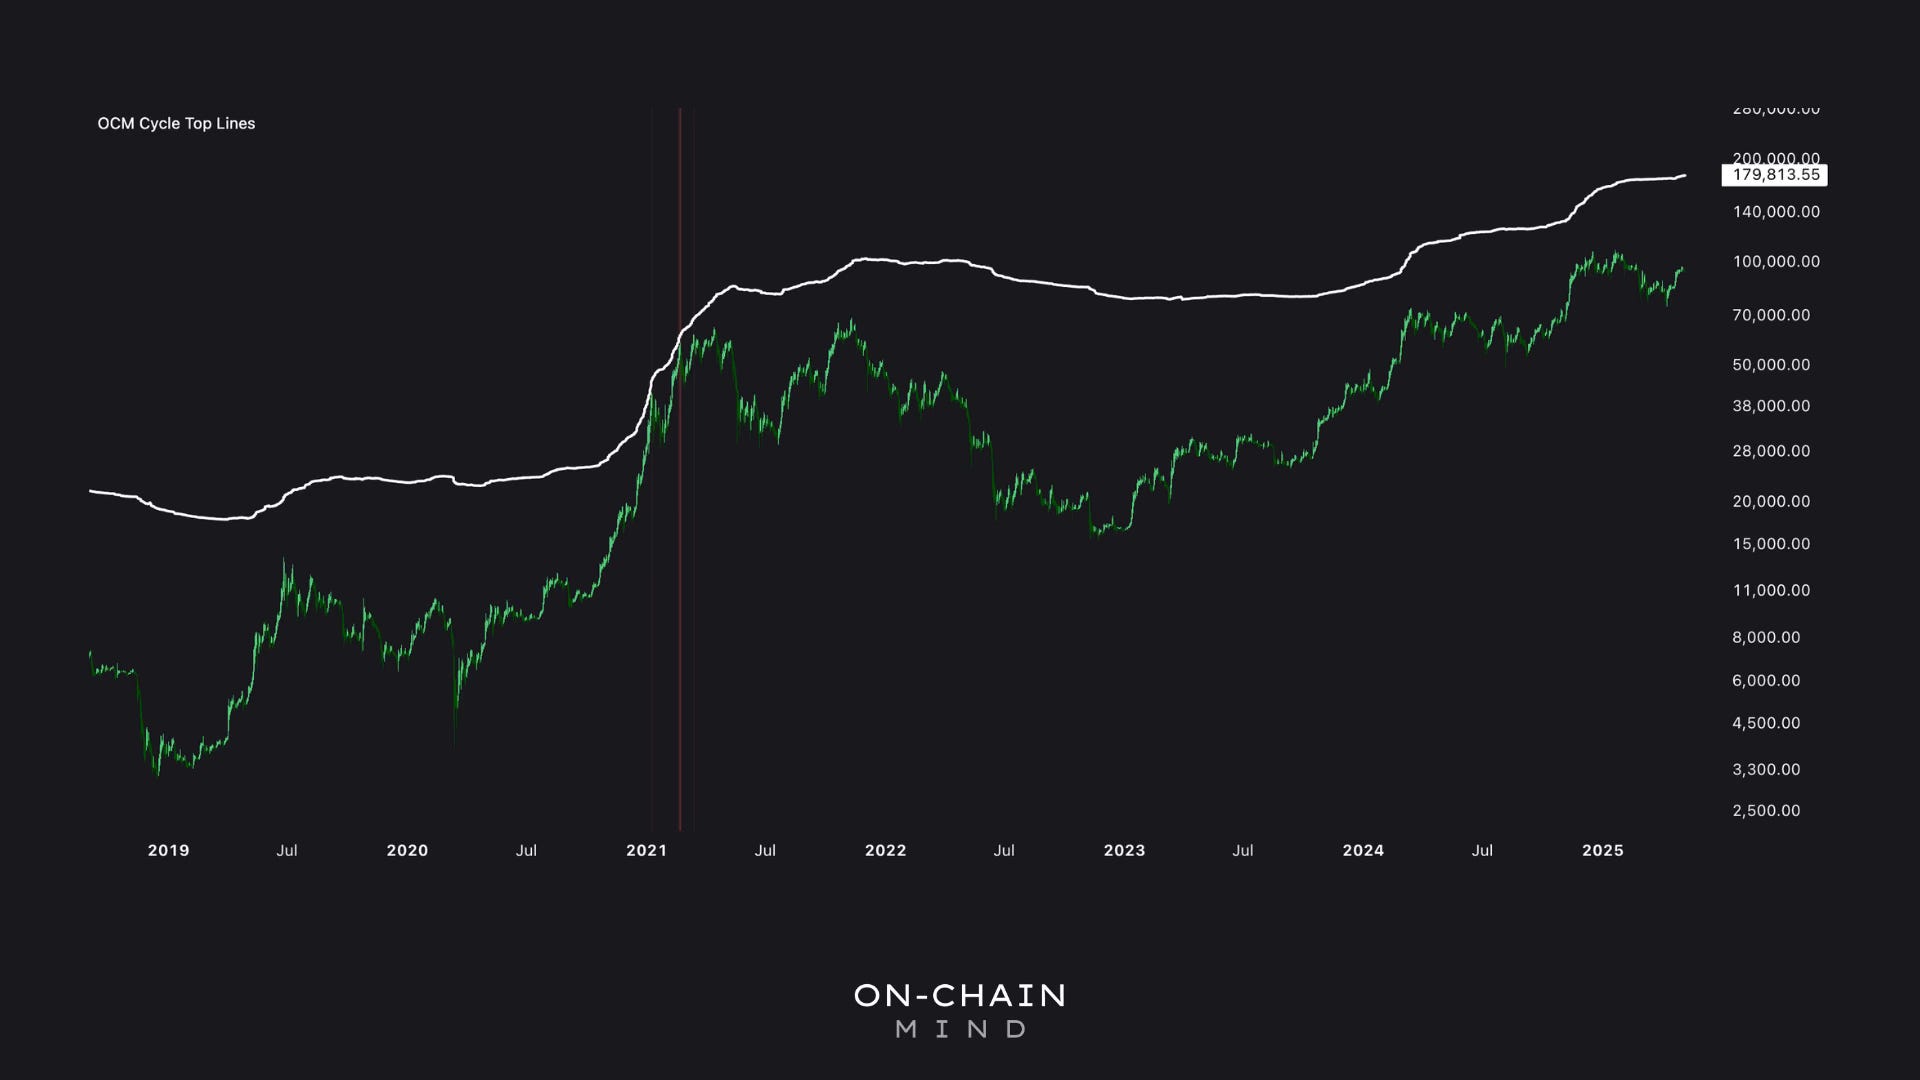
To navigate this divergence, we can use a composite average—a mean of all six indicators, currently sitting at $179,000. This white line on the chart below isn’t a crystal ball but a high-probability zone where a macro top might form. Historical data backs this up:
2021: Bitcoin touched the composite line multiple times, signalling overbought conditions before the crash.
2017: The six lines clustered around $20,000, perfectly flagging the blow-off top.
2013–2014: Even during overshoots, the composite zone acted as a magnet, pulling prices back after extreme surges.
The key is convergence. In past cycles, these metrics diverged during consolidation phases but tightened as Bitcoin entered its parabolic phase. When prices accelerate and the lines cluster, it’s a strong signal that a top is near.
Why Convergence Matters:
Bitcoin’s bull runs follow a predictable pattern: slow accumulation, steady growth, and then a parabolic explosion. The final stage—often called the “blow-off top”—is where fortunes are made and lost. Historically, the six metrics converge during this phase, creating a clear signal for savvy investors.
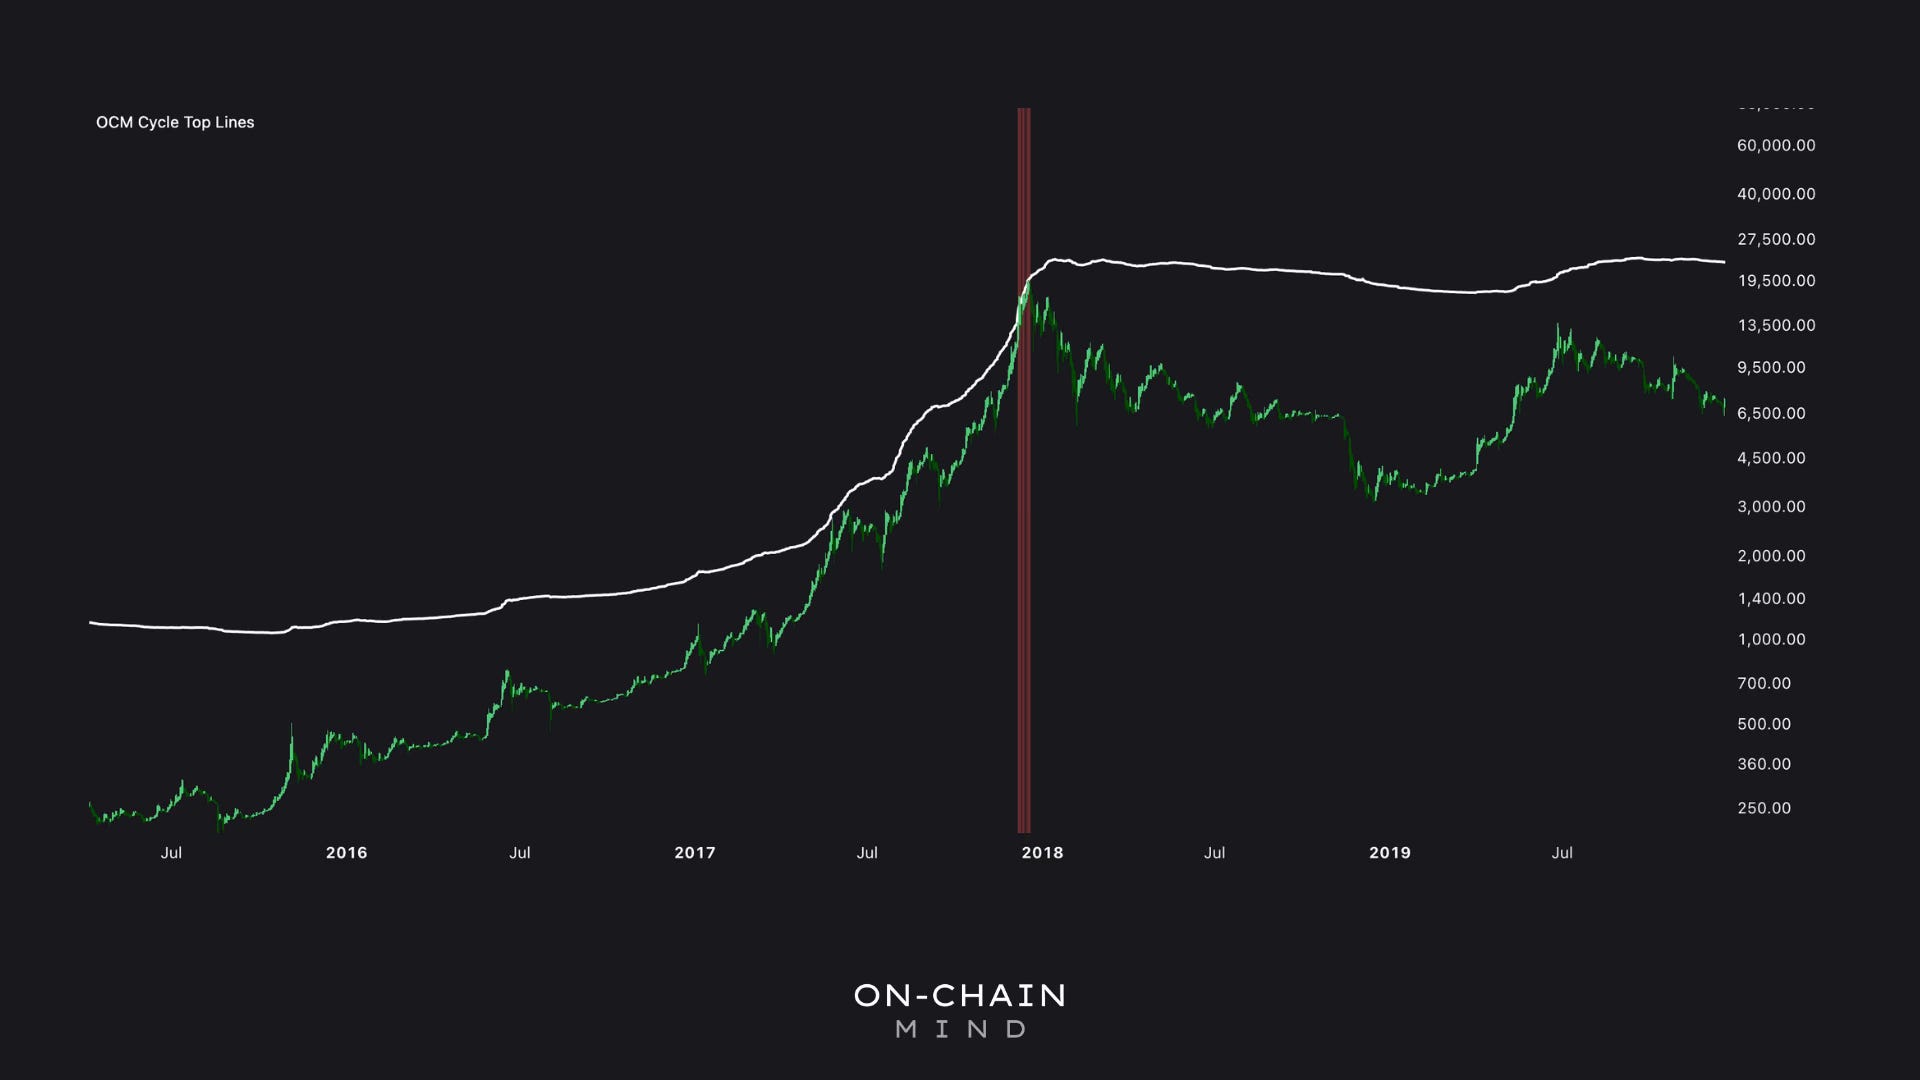
The 2017 Bull Run
In mid-2017, the composite average sat at $2,500, reflecting a consolidating market. As euphoria took hold, all six metrics surged, pulling the white line to $20,000 by December. This rapid convergence flagged the top with precision, giving investors a window to scale out before the crash.
Why It Works
Convergence reflects a alignment of market psychology and on-chain activity:
Long-term holders sell: Metrics like CVE and 4.5x CVDD spike as dormant coins flood the market.
Speculation peaks: Delta Top and 5x Balanced Price capture irrational surges driven by FOMO.
Fundamentals stretch: Terminal Price and 4x Adjusted Realized Price signal when prices exceed network value.
Why Use a Composite Line?
Using a single metric to guide your exit strategy is risky.
Too early? You miss out on upside.
Too late? You ride the crash back down.
To avoid this trap, a composite average line was created. It’s simply the mean average of all six indicators. This:
Smooths out noise
Highlights a balanced top zone
Tracks evolving market conditions
Timing the Exit—What to Watch For
Timing a Bitcoin cycle top isn’t about picking the exact peak—it’s about positioning yourself to act rationally when others are swept up in euphoria. Here’s how to apply these metrics:
✅ What to look for:
Metric convergence — Check if the six metrics are tightening. Top signals align closely
Vertical price movement — Signs of a parabolic move
Touch of the Composite line — Indicates high risk/reward imbalance
Volume & sentiment extremes — FOMO, mainstream headlines, sudden price jumps
❌ What not to do:
Don’t exit just because one metric gets hit early
Don’t base your plan on hopium targets like $500K
Don’t ignore behavioural context
A framework to work by:
Track the average composite line weekly and set alert zones at those levels
Watch for convergence among metrics
Scale out gradually, not all at once
This isn’t about selling the exact top—it’s about reducing risk when it becomes almost irresponsible not to. Bitcoin is a game of cycles—and every cycle ends. Those who prepare exit strategies in advance tend to survive and thrive. Those who don’t?
Well, we’ve all seen what happens.
By focusing on objective, data-driven signals, you remove emotion and bias from the equation. Whether or not Bitcoin reaches $179K, $211K, or overshoots entirely, these models give you the structure to make smarter decisions.
Key Takeaways
Confluence is your edge: The alignment of multiple metrics, like the $179,000 composite average, provides a high-probability zone for Bitcoin cycle tops.
History rhymes: Past cycles show that convergence during parabolic phases reliably signals blow-off tops, as seen in 2017 and 2021.
Patience pays off: Wait for euphoria and metric convergence before acting—don’t chase prices in consolidation phases.
Plan ahead: Use the composite zone to create a disciplined exit strategy, scaling out gradually to avoid emotional traps.
I’ll see you in the next one.
Cheers,
On-Chain Mind
🎥 Watch the video of this article on YouTube!👇
Subscribe to the On-Chain Mind YouTube Channel!