


3 Metrics I’m Using to Spot the Bitcoin Peak

Hey everyone, and welcome back to the On-Chain Mind Newsletter.
Bitcoin cycle tops are short, sharp, and easy to miss. Relying on a single metric isn’t enough when the peak may only last a few weeks.
Historical data shows that the peak lasts just 2-5 weeks, a tiny slice of a typical 4-year cycle. Miss it, and you might be waiting half a decade to get back to break-even.
This article explores 3 indicators I personally rely on to identify the elusive top of the Bitcoin cycle. I‘ll walk through each of these in depth. Not just what they show, but why they work, what their limitations are, and how they complement one another when hunting for the market’s turning point.
Let’s get into it.
Insights at a Glance:
Multiple Perspectives Enhance Accuracy: Combining diverse indicators reduces blind spots and boosts signal reliability.
Logarithmic Deviation Torch: Visualises market risk through dynamic colour-coded dots, highlighting overbought conditions.
Z-Score Probability Waves: Identifies statistical extremes to predict mean reversion and potential price targets.
Macro Cycle Master: Aggregates on-chain data for high-conviction signals of macro tops and bottoms.
Timing the Peak
Bitcoin’s peaks are electrifying yet fleeting. Euphoric surges that vanish in weeks, leaving those unprepared reeling.
Timing the peak isn’t about perfection but preparation, and relying on a single metric is a recipe for missteps. Markets are multifaceted, not just driven by price action but mainly investor behaviour and the larger macroeconomic forces. A single indicator, no matter how robust, has limitations and blind spots that can obscure critical signals or produce false positives.
To address this, we’ll dive into 3 complementary indicators:
Logarithmic Deviation Torch
Z-Score Probability Waves
Macro Cycle Master
Each approaches the market from a unique angle— price deviation, statistical probability, and on-chain behaviour — creating a powerful synergy when used together. By blending technical, probabilistic, and behavioural insights, these unique metrics offer a clearer picture of when Bitcoin’s cycle might peak. Let’s explore each in detail, unpacking their mechanics, historical performance, and practical applications.
The Logarithmic Deviation Torch
The Logarithmic Deviation Torch is a dynamic risk visualiser that plots coloured dots above Bitcoin’s price chart, with hues reflecting market risk. Lighter dots (yellow/peach) indicate low to moderate risk, while darker reds signal extreme overbought conditions. The indicator derives its signals from the logarithmic deviation of Bitcoin’s price from its 374-day simple moving average (SMA), adjusted by a time-scaled logarithmic function. In technical terms, it uses the bar index raised to a power, factoring in both price displacement (how far the price deviates from the mean) and time decay (the duration of the deviation).
This approach is particularly effective because Bitcoin’s price tends to follow a logarithmic growth curve over time, with exponential surges during bull markets and sharp corrections thereafter. By measuring deviations on a logarithmic scale, the Torch captures the magnitude and speed of price movements relative to the long-term trend, providing a nuanced view of market momentum.

On the weekly timeframe, the Torch delivers high-conviction signals, producing one dot per week. Historically, the previous 4 Bitcoin cycle peaks have coincided with between 2–5 dark red dots, indicating a brief window of extreme risk lasting 2–5 weeks—roughly 1–2% of a typical 4-year cycle. This brevity just shows us the importance of timely action.
The current dot is light orange, suggesting moderate risk. Previous moves to $70,000 and $100,000 triggered dark orange dots, but no deep red signals have emerged, indicating the market may still have room to climb before reaching a true peak.
Z-Score Probability Waves
The Z-Score Probability Waves indicator is one of my favourite probabilistic tools that measures how far Bitcoin’s price deviates from its mean, expressed in standard deviations (sigma). Applied to the weekly chart, it smooths out short-term noise to focus on macro mean reversion signals.
A higher Z-score indicates a greater deviation from the mean, increasing the likelihood of mean reversion—a return to average price levels. Historically, Bitcoin peaks align with the +5 sigma band, a rare statistical extreme where price is both emotionally and technically overstretched. But a +4 sigma level might prompt me to begin scaling out, while +5 sigma signals an almost guaranteed high-probability reversal.
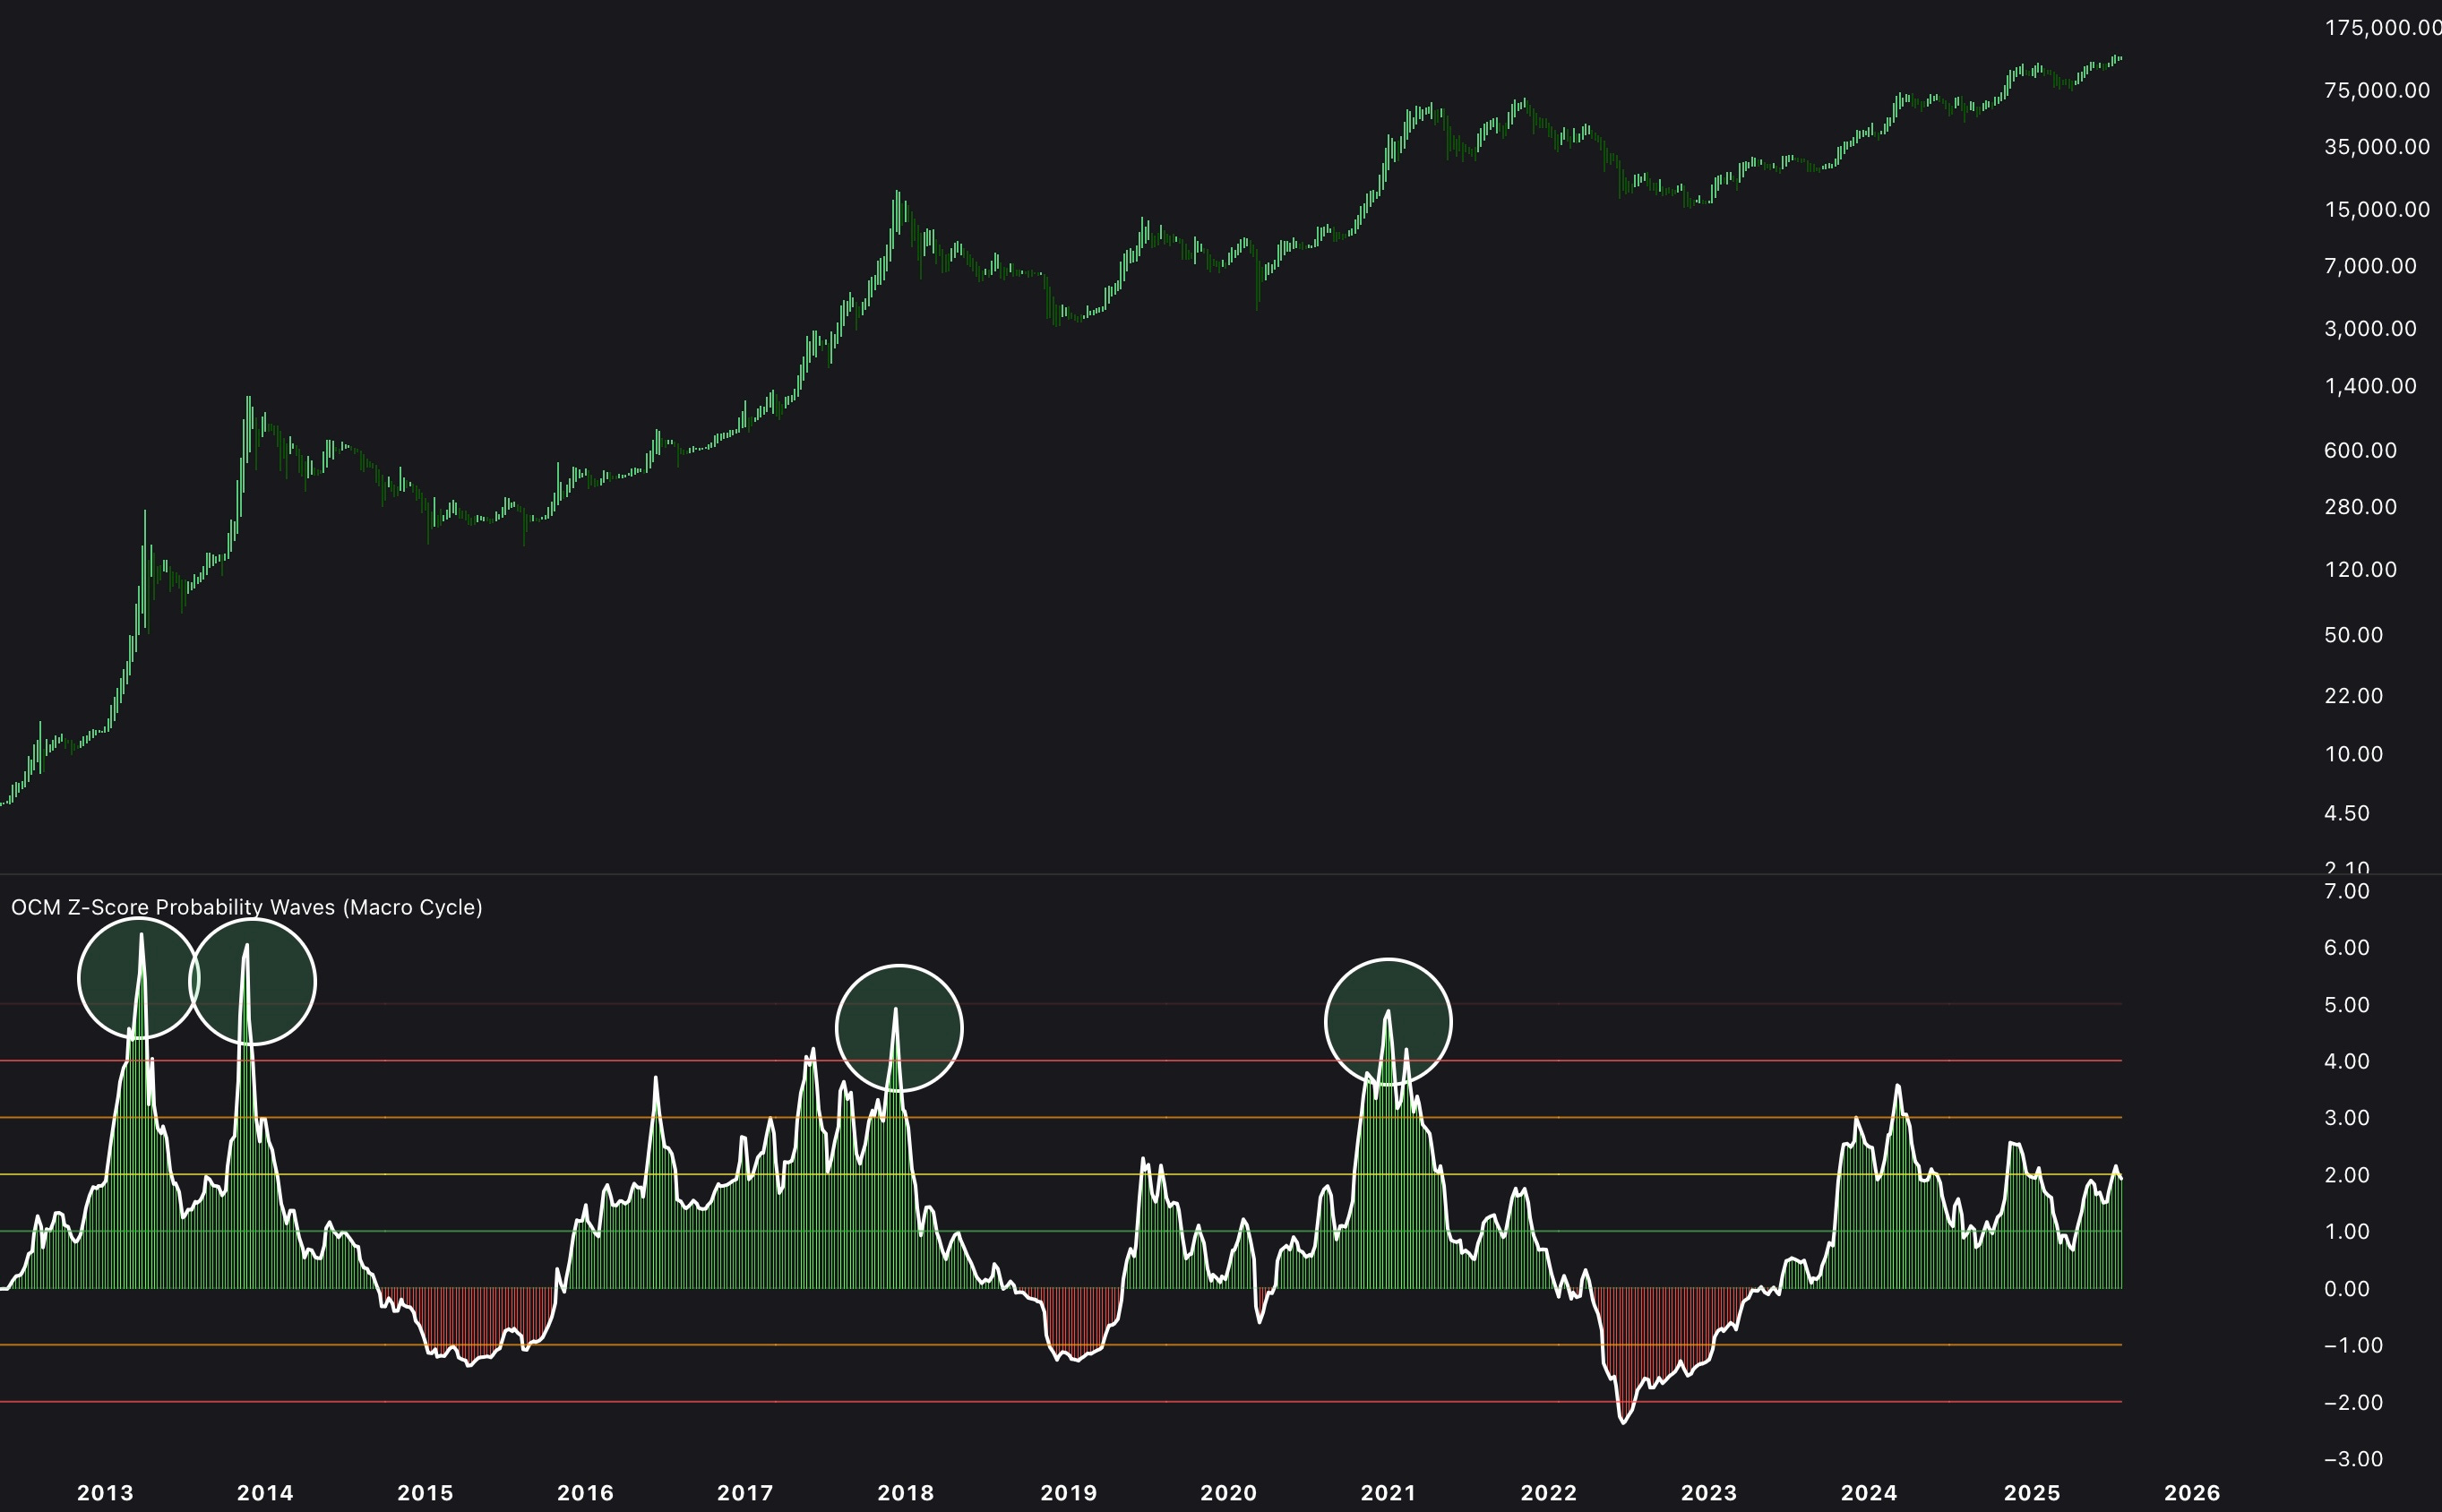
It also dynamically updates price levels for each sigma band, providing real-time targets for potential tops and bottoms. And in past cycles, the Waves have been remarkably accurate.
In the current cycle, the +3 sigma level was breached during the ETF-driven rally, which saw significant upside but reverted to the mean shortly after. And if we went vertical from here, the indicator projects a potential peak at $174,000. Conversely, a bear market could see bottoms at $62,000, with a worst-case scenario of $44,000, reminiscent of the post-FTX crash in 2022. These levels adjust daily based on volatility and market conditions, so it’s on my “regular monitor” list.
Macro Cycle Master
The Macro Cycle Master is an elegantly simple-looking yet complex indicator that aggregates 6 reliable on-chain metrics into a single model. As we know, on-chain data essentially tracks and quantifies investor behaviour through blockchain transactions. When at least 3/6 metrics align, the indicator triggers a visual signal: red for a macro top, green for a macro bottom. This binary output simplifies everything, distilling complex data into a clear, high-conviction signal.
It’s a powerful tool for those who may not have the time or expertise to analyse individual on-chain metrics.

The indicator’s track record is compelling but it varies by cycle:
2017: A single red signal marked the peak, capturing the rapid euphoria and subsequent crash.
2021: Multiple red signals appeared around the top, reflecting a more protracted topping process.
Currently, the indicator shows no signal, suggesting the market is not at a traditional on-chain macro top. And when signals do appear, they provide rapid confirmation of market turning points. On-chain indicators like this are invaluable because they reveal what investors are doing beneath the surface, beyond price action.
Synergy of the 3
The true power of these indicators lies in their combination. Each operates independently, yet their convergence at cycle peaks creates a signal you can’t ignore.
Trying to time the top of a Bitcoin cycle isn’t about precision — it’s about preparedness. We’re not fortune tellers. But by triangulating data from 3 different lenses, we can raise our probability of acting rationally at the moment when everyone else is acting emotionally.
When Twitter/X is screaming to the moon and your portfolio is up another 500%, the temptation is to hold for just one more wave. But as history shows, the exit window is often shorter than you think.
So don’t aim to be perfect. Aim to be ready.
Key Takeaways
Multi-Indicator Approach: Combining the Logarithmic Deviation Torch, Z-Score Probability Waves, and Macro Cycle Master reduces blind spots and enhances signal reliability.
Timing is Critical: Bitcoin’s cycle peaks are brief (2–5 weeks), making high-conviction tools essential for capturing opportunities.
Diverse Lenses: Price deviation, statistical probability, and on-chain behaviour provide complementary insights into market dynamics.
If you want to unlock the full picture — including access to my Custom Indicator Suite — consider upgrading to Premium 🚀
I’ll catch you in the next one.
Cheers,
OCM
🎥 Watch the video of this article on YouTube!👇🏼
Subscribe to the On-Chain Mind YouTube Channel!
love it . can we access all the indicators in the premium suite?
Very interesting read.