

Outperforming Bitcoin with Simplicity
How a simple data-driven strategy beat buy-and-hold by 8x over nine years

Hey everyone, and welcome back to the On-Chain Mind Newsletter.
Today is an experiment. Rather than focusing on deep on-chain data or where we are in the macro cycle, we’re using a metric called the Bull Momentum Gauge to explore Bitcoin’s price patterns, and dive into the mechanics and psychology behind a momentum-based strategy. Instead of trying to estimate the market top and bottom, we’re going to follow a very simple, data-driven strategy, and see whether it outperforms buy-and-hold Bitcoin.
Let’s get into it.
Insights at a Glance:
Understanding the Bull Momentum Gauge: A metric that measures Bitcoin’s bull market legs.
Outperforming Buy-and-Hold: a simple dynamic strategy can yield returns up to 8x higher than holding Bitcoin.
Simplicity in Action: Why clear rules and discipline trump emotional decision-making in Bitcoin trading.
The Power of Data: metrics can provide a robust framework for understanding market behaviour.
Can Simplicity Beat HODLing?
Every Bitcoin investor has asked themselves: Can I do better than simply buying and holding?
While most efforts to “time the market” end up underperforming, a metric I’ve been testing — built purely on price data — might just prove otherwise. It’s not about prediction. It’s about reaction. And the results, frankly, are staggering.
Let me introduce the Bull Momentum Gauge, a strategy that turned a $10,000 Bitcoin investment in 2016 into over $18 million by 2025 — far outpacing any HODLers.
What Is the Bull Momentum Gauge?
At its core, this tool measures how stretched or compressed Bitcoin’s price is relative to its long-term trend. It does so by calculating the inverted Z-score of price deviation from the 365-day moving average, and then comparing that value to its own 200-day moving average.
In plain English:
It identifies when Bitcoin’s price is showing strong, sustained momentum — or when that momentum is breaking down.
The signals it provides — simplified into green (“buy”) and red (“exit”) — give us a framework for riding bull markets without trying to predict when they’ll start or end.
How the Strategy Works
The rules could not be simpler:
✅ When the indicator turns green: Buy and hold
🛑 When it turns red: Exit and stay out
Repeat without questioning it
There’s no discretionary filtering, no macro overlays, no gut feelings — just raw data guiding each move.
This simplicity is key. By removing emotion, second-guessing, and the constant itch to act, we allow a trend-following engine to do the heavy lifting.
Historical Performance: From 2016 to 2025
Let’s walk through how this strategy would have played out had we followed it religiously from May 2016 onward, with a $10,000 investment (~22.7 BTC at the time):
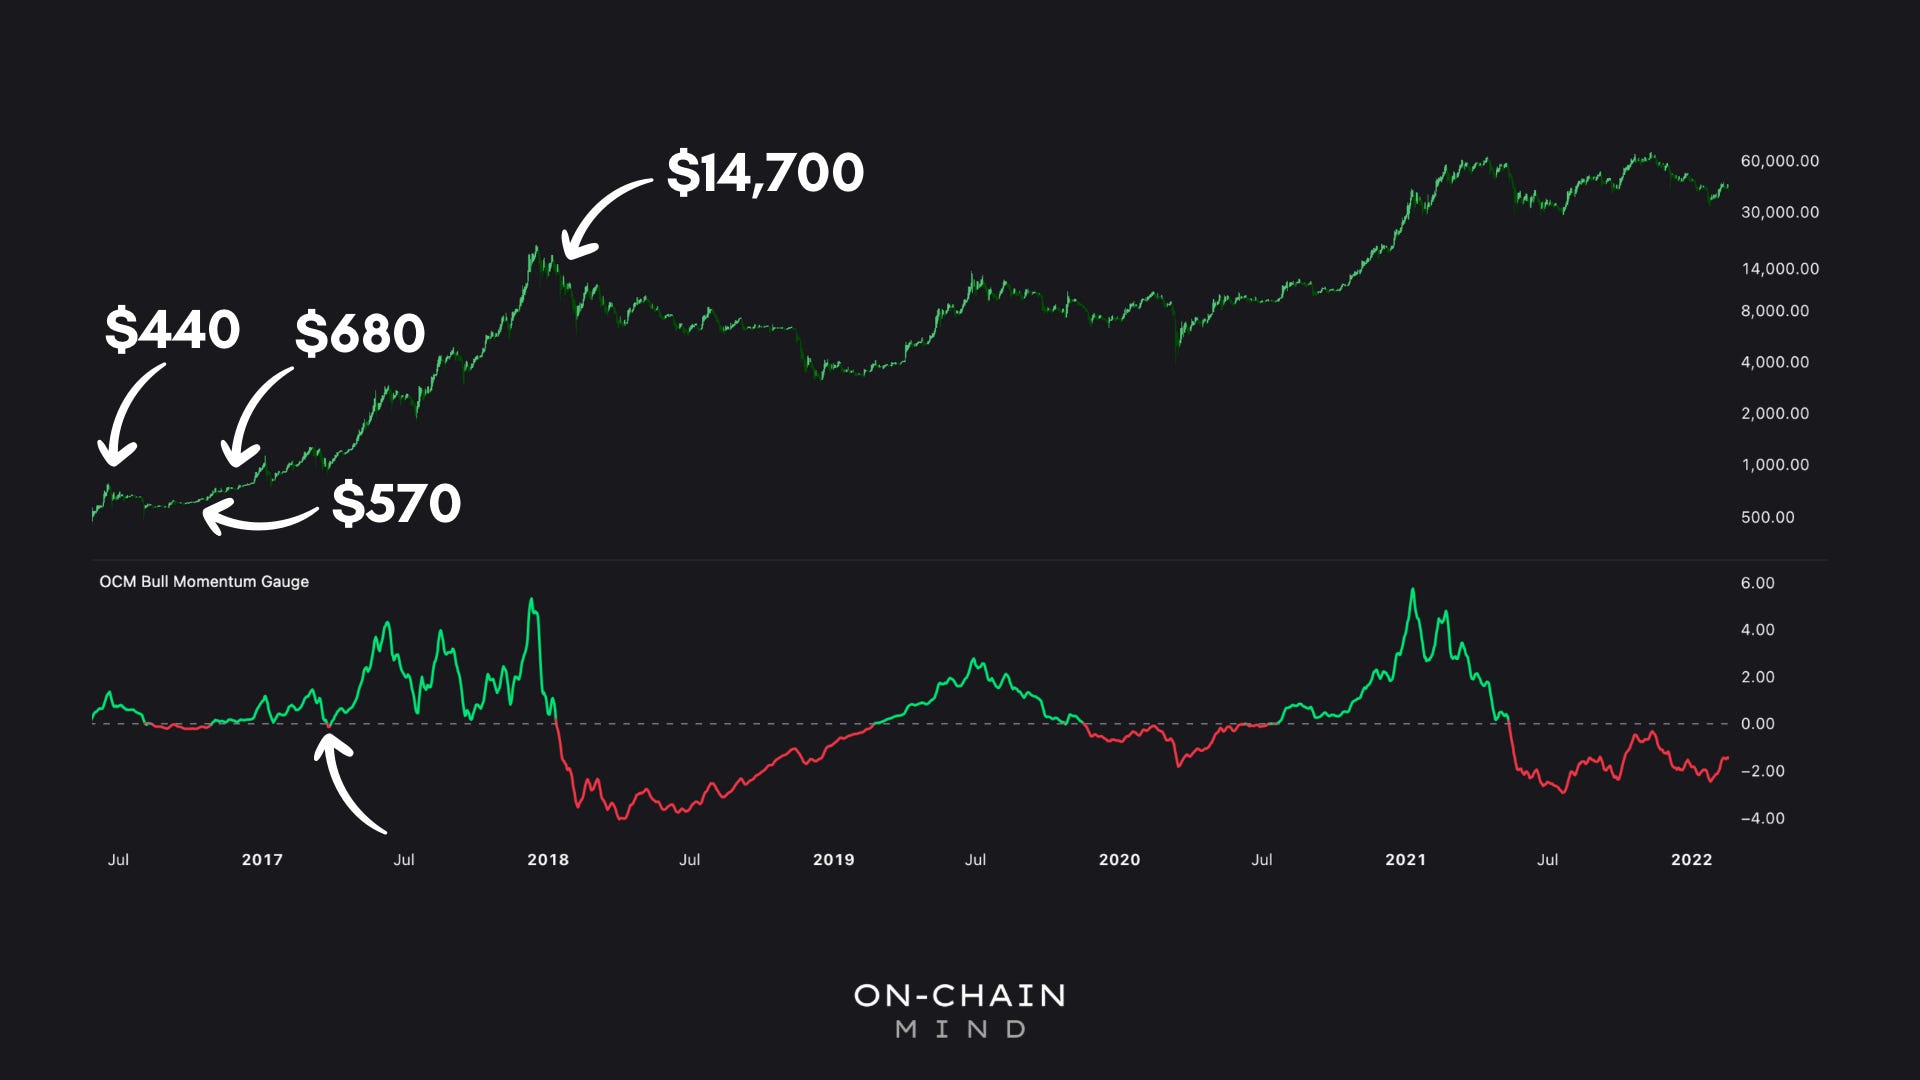
2016–2018: Riding the Mega Bull Run
Buy at $440
Sell at $570 (when red flashes) → $12,900
Buy again at $680, sell at $14,700 in early 2018
Portfolio now: $281,000
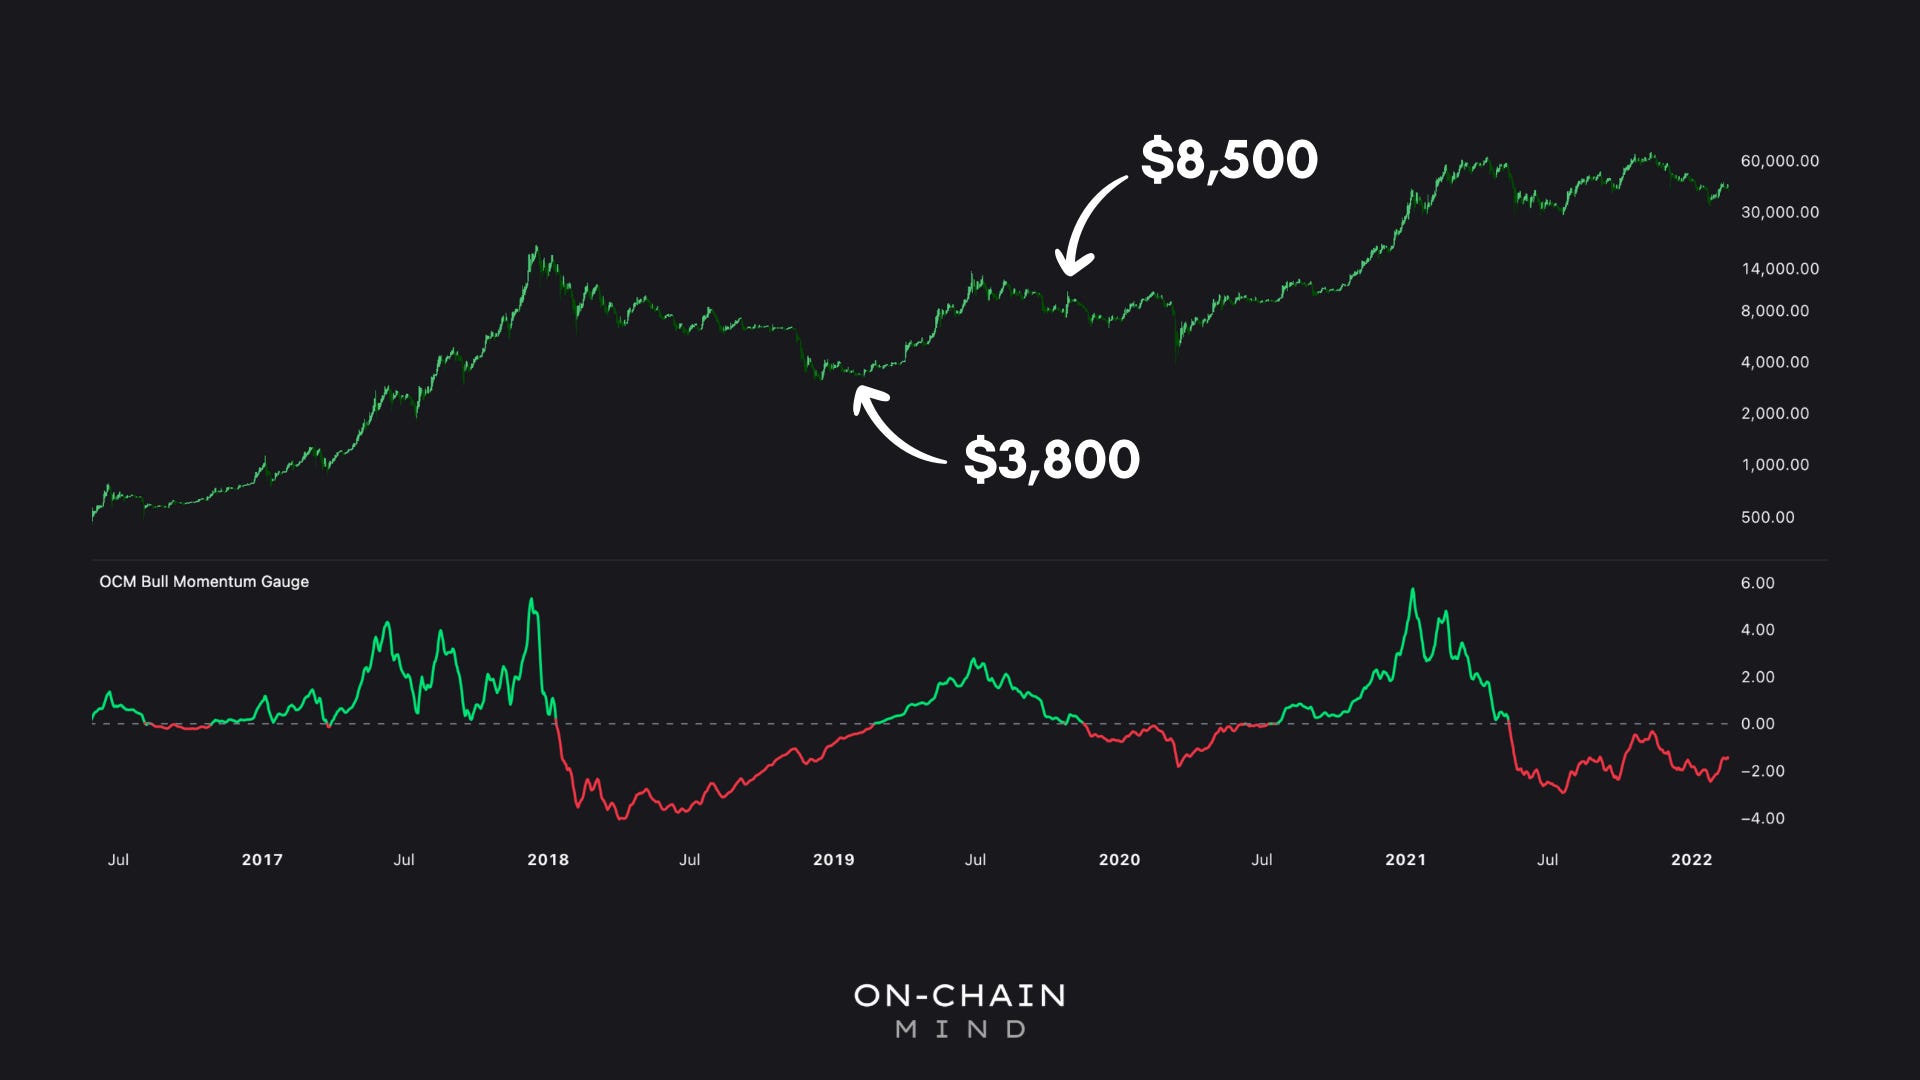
2018–2020: Sideline Patience During the Bear
Out of the market through the bulk of the 2018–2019 bear
Re-enter at $3,800, sell at $8,500
Portfolio grows to: $632,000
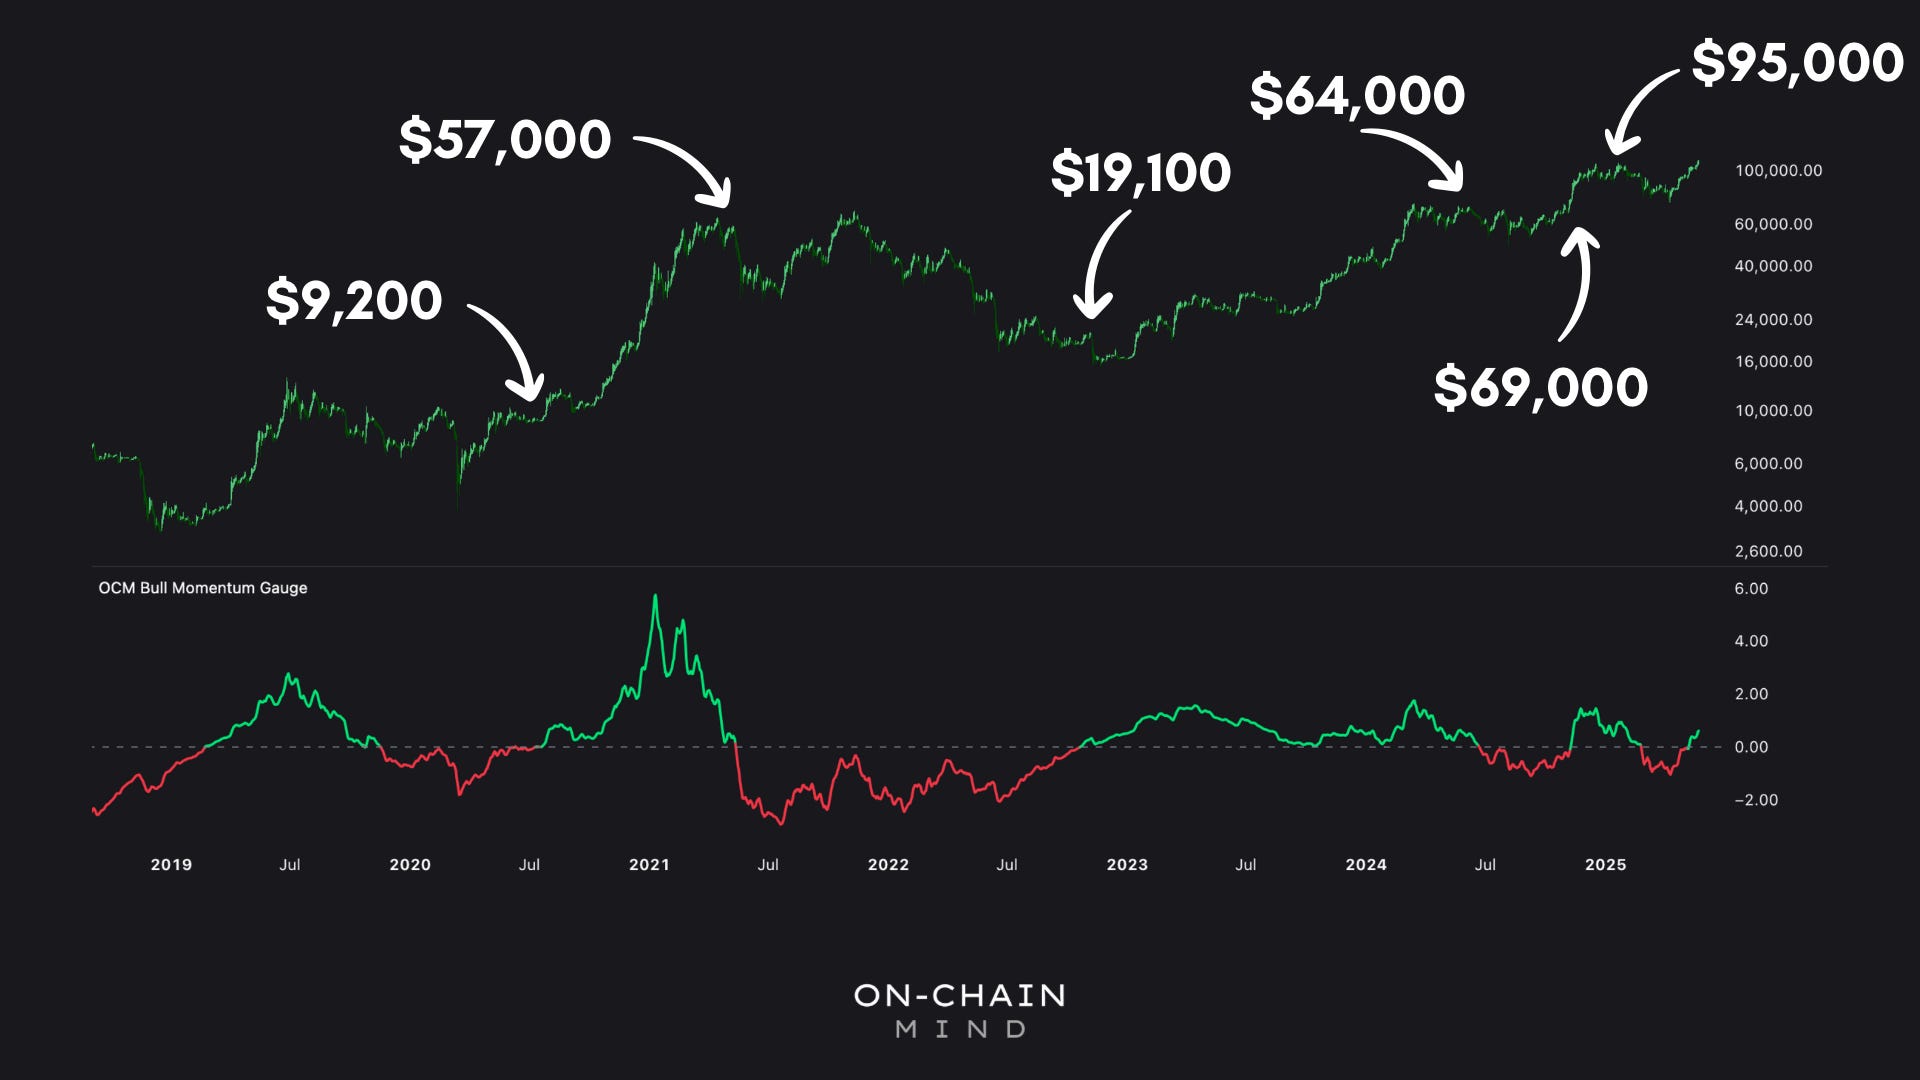
2020–2021: Catching the COVID Rally
Buy again in July 2020 at $9,200
Exit in early 2021 at $57,000
Now worth: $3 million
2022–2024: Sideways Markets, Selective Re-Entry
Re-enter in late 2022 at $19,000
Sell mid-2024 at $64,400
Portfolio hits: $13.2 million
Final Trades (2024–2025)
Buy again at $69,000, sell at $95,000
Final portfolio value: $18.3 million
Total BTC grown from 22.7 to 191 BTC
This is without any leverage, with full capital reinvestment, and no use of on-chain or macro inputs. Just one signal. One rule.
Why It Works: Riding Trends, Avoiding Chop
This strategy doesn’t aim for perfection. It doesn’t sell the top or buy the bottom. What it does do is identify persistent trends — and stay in them long enough to capture the bulk of the move.
Avoids emotional decision-making
Bypasses short-term noise and fakeouts
Outperforms passive HODLing
No macro narrative needed — it’s price-led and objective
What About Buy-and-Hold?
A long-term HODL investor who put $10,000 into Bitcoin in May 2016 would be sitting on roughly $2.27 million today. That’s a phenomenal return — a 226x increase.
But this strategy returned $18.3 million — over 8x more.
And importantly, it avoided nearly every major drawdown along the way. That’s not just a financial advantage — it’s psychological survival. Many investors panic sell during crashes. This strategy gives them an unemotional way to stay disciplined.
Can It Be Improved?
Absolutely. The version shown here is deliberately simple, but it could be enhanced by:
Adding during bullish retests (averaging in with extra capital)
Combining with other metrics like on-chain activity or macro signals
Automating execution to remove latency and second-guessing
But even in its rawest form, the outperformance speaks for itself.
Should You Use It?
It depends. This isn’t financial advice — just an exploration of what’s possible using price data alone. For many, a standard DCA strategy might be optimal. For others with the time and curiosity to study the market, tools like this offer a data-driven edge. And remember, this strategy doesn’t predict the future. It doesn’t claim to be infallible. What it does is offer a repeatable framework for reacting to real-time momentum.
Final Thoughts: Beyond This Metric
This is just one of many tools available to the Bitcoin investor. If you’re interested in diving deeper, look beyond price data — you can explore the many on-chain and price metrics that exist. The more you understand how Bitcoin’s market behaves, the more you can identify setups that suit your personality, risk appetite, and time horizon.
Key Takeaways
Momentum Matters: The Bull Momentum Gauge shows how riding Bitcoin’s momentum can vastly outperform passive strategies.
Simplicity Wins: Clear, data-driven rules reduce emotional errors and enhance consistency.
Data Is Power: Price and on-chain metrics offer actionable insights into market cycles.
Learn and Adapt: Exploring data and testing strategies can make you a better investor, even beyond Bitcoin.
I’ll see you in the next one.
Cheers,
On-Chain Mind
🎥 Watch the video of this article on YouTube!👇
Subscribe to the On-Chain Mind YouTube Channel!
On-Chain is this indicator part of the monthly subcription ?
Cheers
I just tried to make a similar indicator using your blog.
//@version=5
indicator("Bull Momentum Gauge (Fixed)", overlay=true)
// === INPUTS ===
maLength = input.int(365, title="MA Period (days)")
zmaLength = input.int(200, title="Z-score MA Period")
src = close
// === CALCULATE Z-SCORE ===
ma = ta.sma(src, maLength)
stdev = ta.stdev(src, maLength)
zscore = (src - ma) / stdev // Not inverted
// === SIGNAL LINE ===
zscore_ma = ta.sma(zscore, zmaLength)
// === ENTRY LOGIC ===
bullish = zscore > zscore_ma
bearish = zscore < zscore_ma
// === PLOT SIGNAL BACKGROUND ===
bgcolor(bullish ? color.new(color.green, 85) : bearish ? color.new(color.red, 85) : na)
// === PLOT SIGNAL MARKERS ===
plotshape(bullish and not bullish[1], title="BUY", location=location.belowbar, style=shape.labelup, color=color.green, text="BUY")
plotshape(bearish and not bearish[1], title="EXIT", location=location.abovebar, style=shape.labeldown, color=color.red, text="EXIT")
// === DEBUG PLOT ===
showZ = input.bool(false, title="Show Z-score Plot")
plot(showZ ? zscore : na, title="Z-score", color=color.blue)
plot(showZ ? zscore_ma : na, title="Z-score MA", color=color.orange)